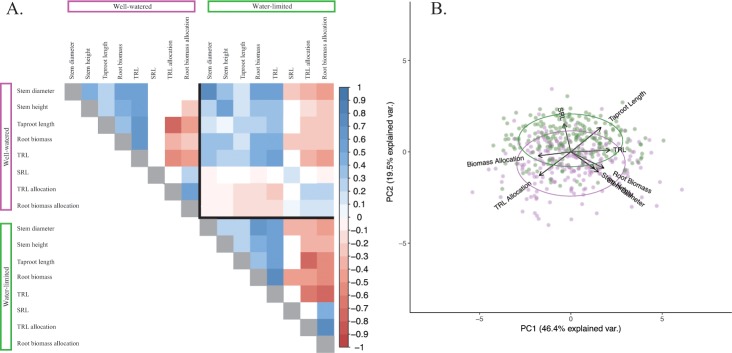
Fig 2. Phenotypic response of sunflower seedlings to osmotic stress.
(A) Trait-trait correlations within and across treatments. Traits grouped by a purple line are from the well-watered treatment, while traits grouped by the green line are from the water-limited treatment. Colored boxes correspond to correlations that are significant after correcting for multiple corrections, with color and gradient indicating direction and strength of correlation. (B) First two principal components of principal component analysis with all traits (n = 8). Individual genotypes are shown as circles and are represented twice in the figure, once per treatment. Color denotes treatment, with purple being well-watered and green being water-limited.

