
Figure 2. Funnel plot for Hedge’s g & standardized effect for each effect in the meta-analysis.
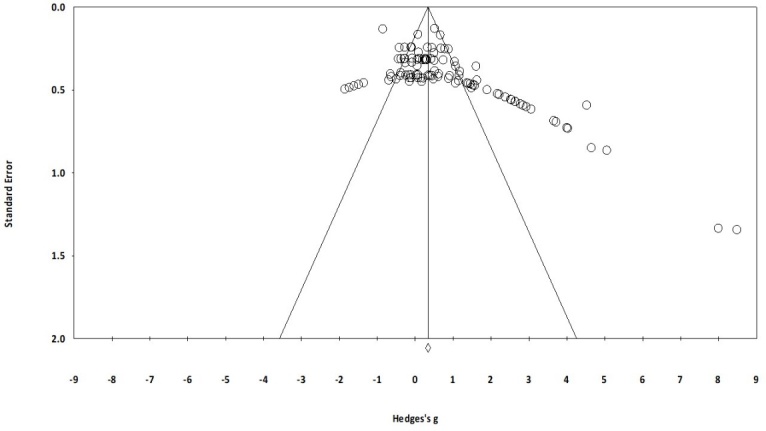
Each of the effect is represented in the plot as a circle. Funnel boundaries represent area where 95% of the effects are expected to abstain if there were no publication bias. The vertical line represents mean standardized effect of zero. Absence of publication bias is represented when the effects should be equally dispersed on either side of the line.