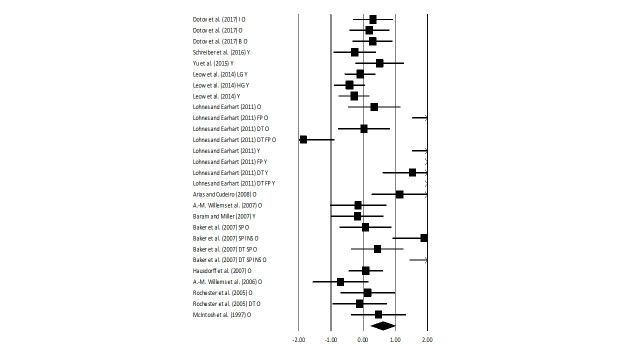
Figure 5. Forest plot illustrating individual studies evaluating the effects of rhythmic auditory cueing on stride length among healthy young and elderly participants.
A negative effect size indicated reduction in stride length; a positive effect size indicated enhancement in stride length. Weighted effect sizes; Hedge’s g (boxes) and 95% C.I (whiskers) are presented, demonstrating repositioning errors for individual studies. The (Diamond) represents pooled effect sizes and 95% CI. A negative mean difference indicates a favorable outcome for control groups; a positive mean difference indicates a favorable outcome for experimental groups. (O: Old, Y: Young, FP: Fast paced, SP: Slow paced, DT: Dual-task, I: Isosynchronous, B: Biological variability, LG: Low groove, HG: High groove, INS: Instructions, Mt: Motivating feedback, NMt: Non-motivating feedback).

