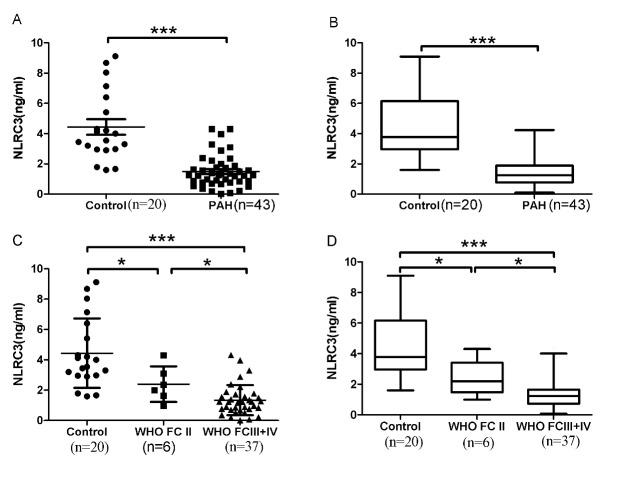
Figure 1. Serum NLRC3 concentrations were reduced in PH patients versus controls.
The scatter plots on the left and the Box-and-Whisker plots above on the right provided data for serum NLRC3 concentrations (Fig. 1A and 1B) in control subjects (n = 20), and patients with PH (n = 43). Serum NLRC3 concentrations decreased in PH severity. The scatter plots on the left and the Boxand-Whisker plots on the right below provided data for serum NLRC3 concentrations (Fig. 1C and 1D) according to WHO FC. Control: n=20; WHOFC II: n = 6; WHOFCIII-IV: n = 37. The scatter plots showed the mean±SD; the Box-and-Whisker plots showed the median with IQR±5-95th percentile. *p<0.05, ***p<0.0001.

