
Figure 5. LRIC upregulated the expression of p-eNOS.
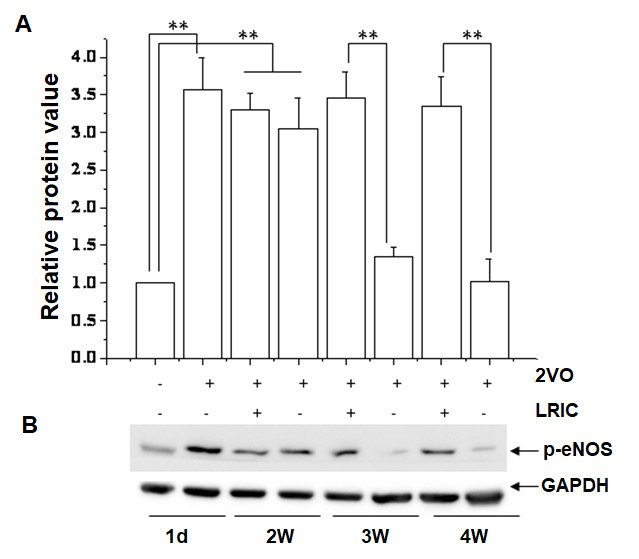
A) Bar graph shows a quantification of p-eNOS/GAPDH ratio in different stage after 2VO. ** P<0.01. N = 5 per group. B) Representative images showing expression of p-eNOS.
Official websites use .gov
A
.gov website belongs to an official
government organization in the United States.
Secure .gov websites use HTTPS
A lock (
) or https:// means you've safely
connected to the .gov website. Share sensitive
information only on official, secure websites.
A) Bar graph shows a quantification of p-eNOS/GAPDH ratio in different stage after 2VO. ** P<0.01. N = 5 per group. B) Representative images showing expression of p-eNOS.