
Figure 6. NOS inhibitor suppressed the effect of LRIC on vessels number in hippocampus.
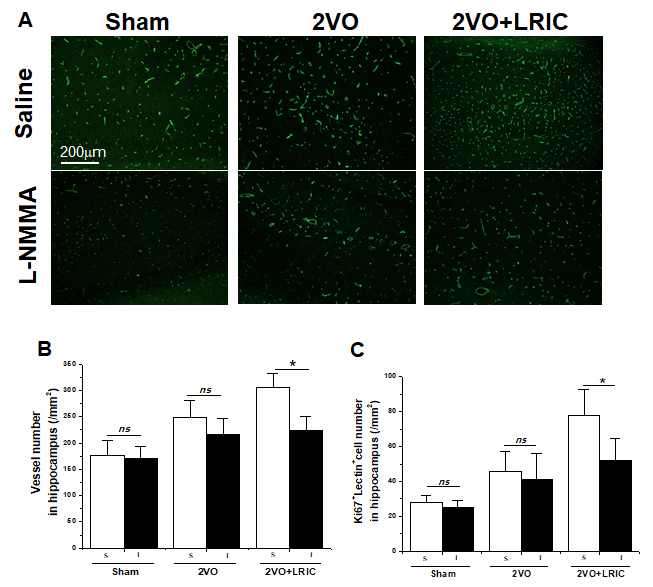
A) Representative images of vessels in the hippocampus detected by lectin. B) Bar graph shows a quantification of vessels number. * P<0.05. N = 6 per group. C) Bar graph shows a quantification of Lectin+/Ki67+ cells. N = 6 per group. **P < 0.01.