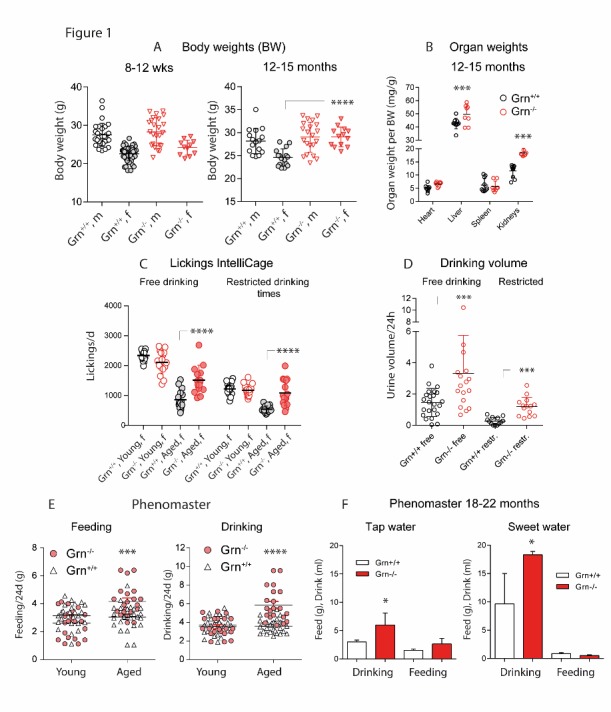
Figure 1. Body weight, drinking and feeding behavior of progranulin deficient (Grn-/-) and control mice (Grn+/+).

A) Scatter plots showing the body weight of young and aged male and female Grn-/- and Grn+/+ mice. B) Organ weights of aged Grn-/- and Grn+/+ mice. C) Number of lickings within 24h in the IntelliCage during free-drinking and restricted-drinking experiments. During ’free-drinking’, access to the water bottles was allowed for 24h on nosepoking at the doors. During ’restricted-drinking’, access to the water bottles was mostly denied except for 2x2h per day (11-12 am and 4-5 pm). D) Scatter plots showing the 24h drinking volume of aged Grn-/- and Grn+/+ mice during free drinking and water restriction for 2x12h with one-hour free drinking in between. E) Scatter plots showing the weight of food and water consumed within 24h in sex-matched young and aged Grn-/- and Grn+/+ mice in the Phenomaster cage. F) Phenomaster analysis of drinking and feeding behavior of old Grn-/- and Grn+/+ mice during presentation of tap water or sweet water with 20% sucrose (mean ± SD). The data show the food weight and drinking volume consumed within 24h. For all subpanels each scatter represents one mouse, the line is the mean and the whisker show the standard deviation (SD). Asterisks indicate statistically significant differences between genotypes (unpaired, 2-tailed Student’s t-test for each gender, organ, drinking or feeding. * P< 0.05, ** P<0.01, *** P<0.001, **** P<0.0001).
