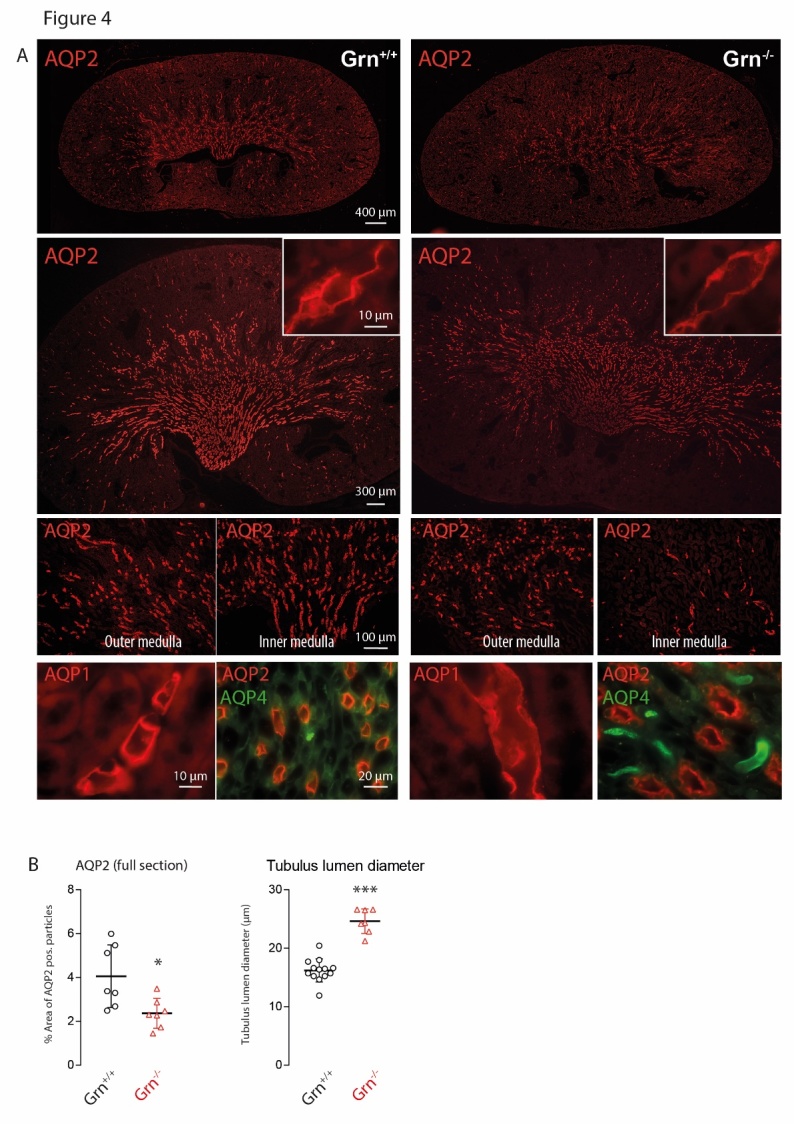
Figure 4. Immunofluorescence analysis of aquaporin 1, 2 and 4 (AQP1, AQP2, AQP4) in the kidney of aged progranulin deficient (Grn-/-) and control mice (Grn+/+).

A) Examples of AQP2 immunofluorescence at low (upper panels) and high magnifications (bottom panels and insert). Scale bars as indicated in the figure. The bottom panel also shows high AQP1 and AQP4 at high magnification, which did not differ between genotypes. B) Quantification of AQP2 positive particles using stitched full sections of the kidney of 4 mice per group. Each scatter is a section. Analysis of the tubule lumen as assessed by measuring the lumen area in 4 sections of 4 mice per group. Each scatter is one AQP2 positive collecting duct. The images suggest reduced AQP2 expression and widening of AQP2+ collecting ducts. Asterisks indicate significant differences between genotypes, unpaired 2-tailed Student’s t-test *P<0.05, ***P<0.001).
