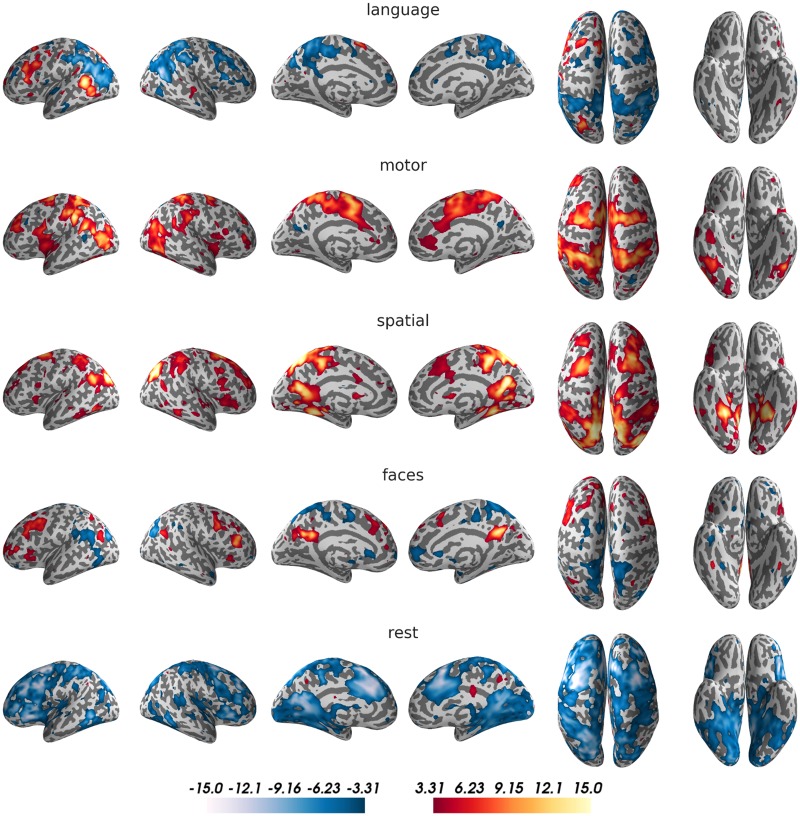
Fig 2. Activity maps for the five conditions of the training data.
For visualization purposes, t-maps for the comparison of each condition against the remaining four were generated (smoothed with an 8mm kernel and thresholded at t = 3.31, corresponding to p<0.001). Results were projected on an inflated surface of the participant’s normalized structural scan, using PySurfer. Interactive unthresholded versions of these maps are available on NeuroVault (https://neurovault.org/collections/3467/).

