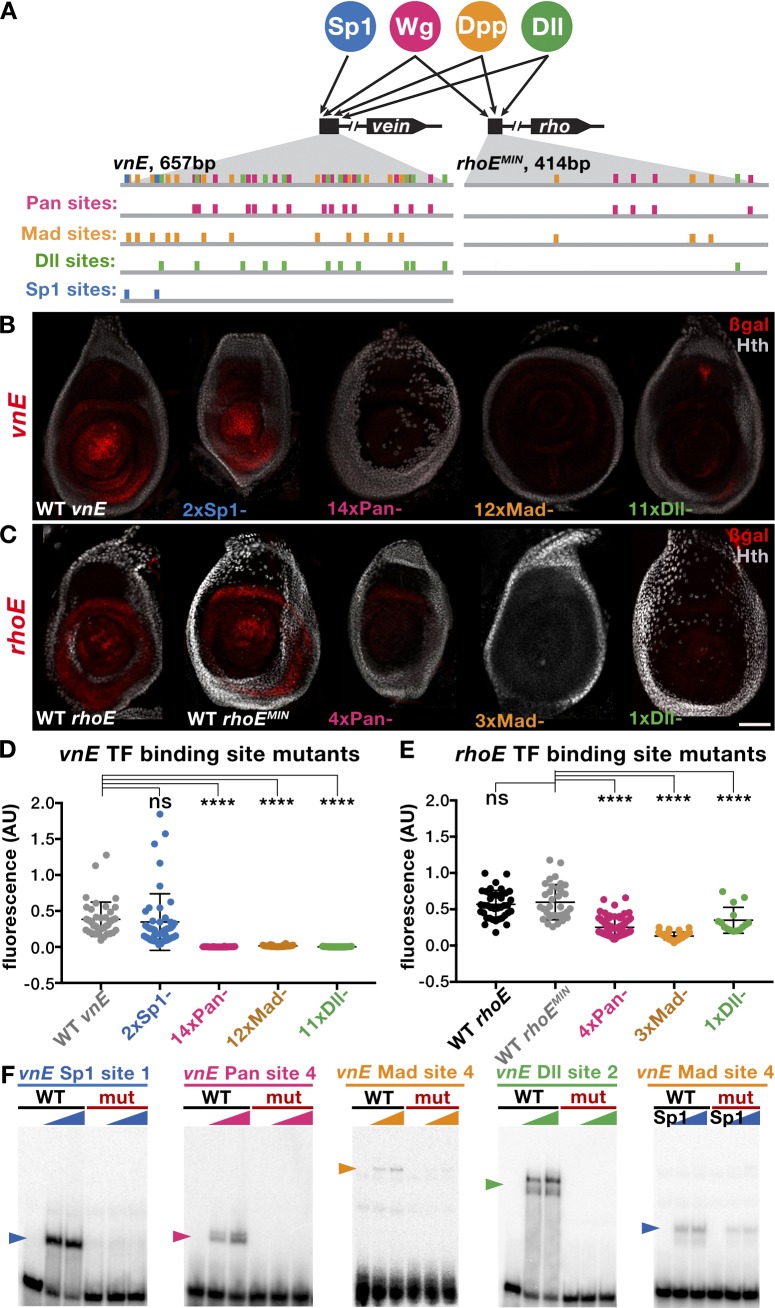
Fig 5. Dissection of Pan, Mad, Dll and Sp1 inputs into vnE and rhoE.
(A) Schematic representation of binding sites in vnE and rhoE. Putative binding sites for each TF were mutagenized one at a time leading to progressive increase in the number of mutant binding sites until the expression driven by a mutant enhancer was lost. Sites in each TF category that were mutagenized either first or last are not sufficient for full enhancer-driven expression since fragments of vnE and rhoE (Fig 1B and 1G; S1 Table) that contain multiple such sites from each TF input cannot drive correct expression pattern. (B) Expression pattern of WT vnE-driven expression and mutant vnE enhancer-driven expression. (C) Expression pattern of WT rhoE-driven expression and mutant rhoE enhancer-driven expression. (D) Quantification of WT and mutant vnE-driven expression levels in third instar leg discs (WT vnE n = 41, 2xSp1 n = 48, 14xPan n = 24, 12xMad n = 32, 11xDll n = 49 where n indicates number of leg discs analyzed). For normalization, fluorescence was calculated as a ratio of β-gal:Dll intensity in the center of the leg disc (see Methods for details).(E) Quantification of reduction of WT and mutant rhoE-driven expression in third instar leg discs (WT rhoE n = 39, WT rhoEMIN n = 35, 4xPan n = 78, 3xMad n = 41, 1xDll n = 15 where n indicates number of leg discs analyzed). For normalization, fluorescence was calculated as a ratio of β-gal:Dll intensity in the center of the leg disc (see Methods for details).(F) EMSA analysis of selected WT vs mutant binding sites.

