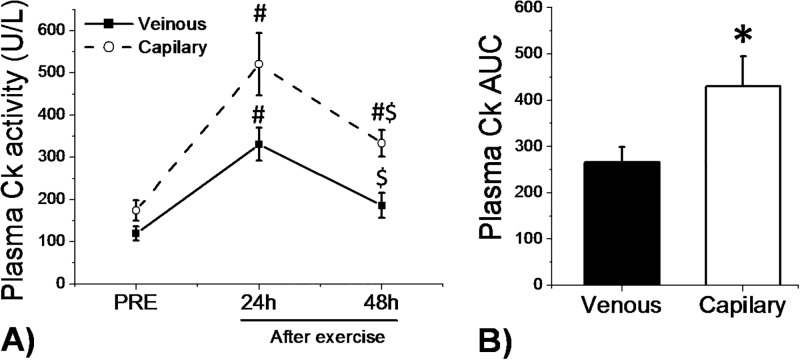
Fig 1.
Behavior of plasma total CK determined using venous and capillary sampling pre-exercise and 24h and 48h after a training session (A) (# indicates significant difference compared to Pre; $ indicates significant difference compared to 24h; P < 0.05 by linear effects mixed model). Plasma total CK area under curve (AUC) determined using venous and capillary sampling (B) (* indicates significant difference compared to venous sampling; P < 0.05 by Student’s t test).

