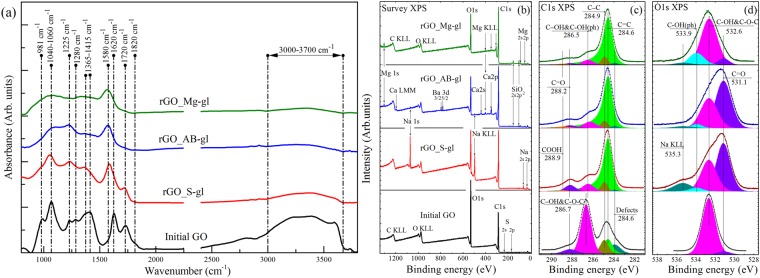
Figure 2.
(a) FTIR spectra of the initial graphene oxide and GO reduced by using glass wafers. The spectra are vertically offset for clarity. (b) Survey (a) and high-resolution C1s (b) and O1s (c) XPS spectra of the initial GO and obtained rGOs. For clarity, C 1 s and O 1 s spectra and their fits are shown after Shirley background subtraction and vertically offset from the fitting components. The C 1s spectra were fitted by a set of one asymmetric Doniach-Sunjic function (DS) and five symmetric Gaussian−Lorentzian product functions (Gaussian by 70% and Lorentzian by 30%) (GL(30)), while the O 1s spectra were fitted by only the GL(30) functions whose number varied from 3 to 5.

