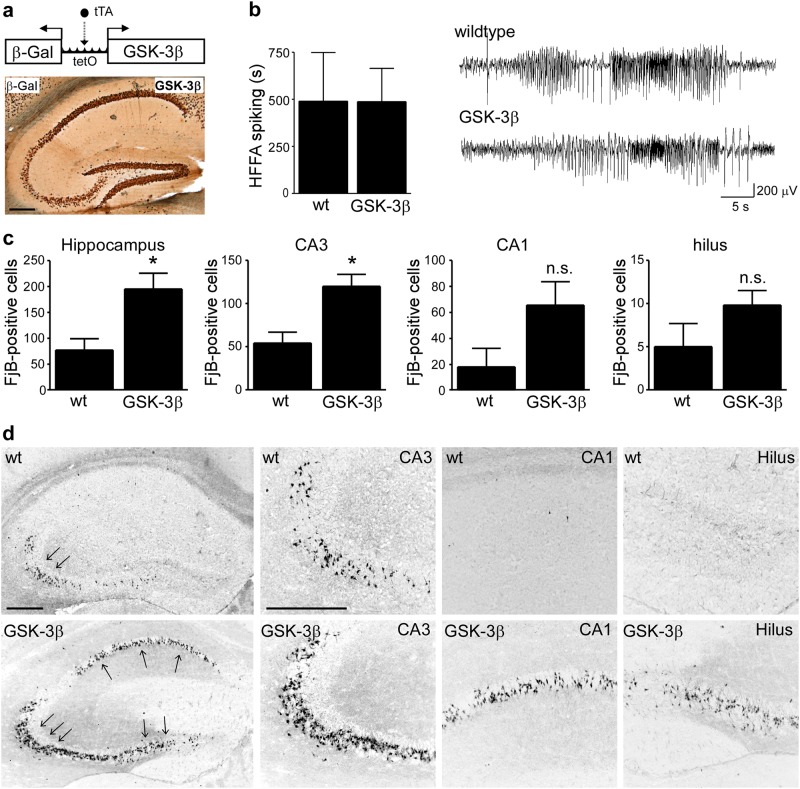
Fig. 2. Increased neurodegeneration in GSK-3β-overexpressing mice following SE.
a Schematic showing strategy to overexpress GSK-3β in neurons and photomicrograph (×5 lens) showing reporter gene expression (β-Gal) in the hippocampus. Scale bar = 500 µm. b No significant differences in high-frequency high-amplitude (HFHA) spiking between GSK-3β-overexpressing mice and wild-type (wt) mice during SE (mean ± s.d., p = 0.99, by Student’s two-tailed t test, n = 3 (wt) and 5 (GSK-3β)). c Graph showing increased neurodegeneration in the hippocampus in mice overexpressing GSK-3β when compared to wild-type mice 72 h following SE with the CA3 subfield of the hippocampus of GSK-3β-overexpressing mice showing the highest increase in seizure-induced cell death (mean ± s.d., *p < 0.05 by Student’s two-tailed t test, n = 5 (wt) and 11 (GSK-3β). d Representative photomicrographs (×5 and ×20 lens) of FjB staining in the hippocampus of wt and GSK-3β-overexpressing mice 72 h following SE. Scale bar = 500 µm for hippocampal overview and for hippocampal subfields. n.s. not significant

