Fig. 6.
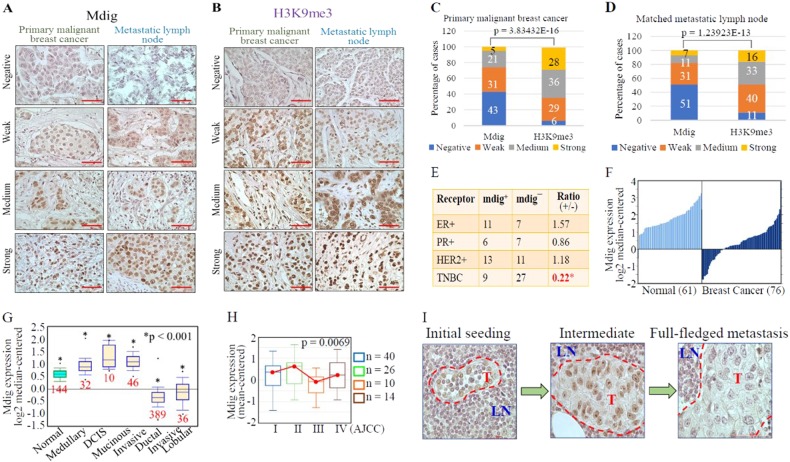
Loss of mdig expression in invasive and metastatic breast cancers. a Mdig expression pattern in primary malignant breast carcinoma and matched metastatic carcinomas in lymph nodes. b H3K9me3 staining pattern in primary malignant breast carcinoma and matched metastatic carcinoma in lymph nodes. Data represent 154 cases, ×40 magnification, scale bar = 50 µm. c, d Quantification of scored images for mdig and H3K9me3 in breast cancer (c) and matched metastatic lymph nodes (D), respectively. e, f Loss of mdig expression in TNBC and invasive breast cancer (data source: http://www.oncomine.org). g Relative levels of mdig expression in breast cancers with different histological subtypes (CURTIS Breast, n = 2136, Oncomine). h Relative levels of mdig expression in breast cancers with different AJCC stages (UCSC Xena, http://xena.ucsc.edu). i Loss of mdig expression in breast cancer cells that metastasized to lymph nodes. Representative images from the metastatic lymph nodes showing the characteristic phenotype of cells positive for mdig. Left panel, very few tumor cells that are positive for mdig were detected in lymph nodes; middle panel, increased number of tumor cells in the lymph nodes, some of which showed weak staining for mdig; right panel, full-fledged tumor within the lymph node showing loss of mdig in tumor cells. LN = lymph node area, T = Tumor area; ×40 magnification. Scale bar = 50 µm

