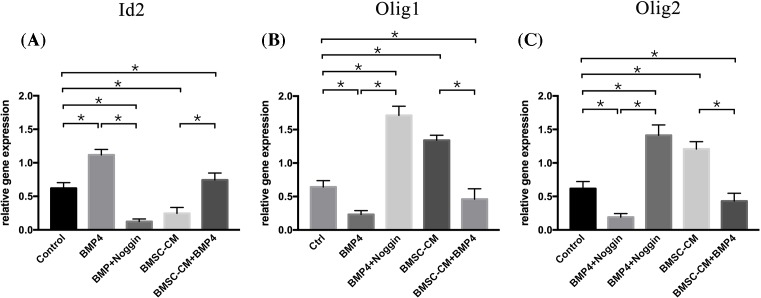
Figure 3. The effects of BMP4 or BMSC-CM were associated with changes in Id2, Olig1, and Olig2 expression.
Quantitative RT-PCR analysis of Id2, Olig1, and Olig2 expression revealed that cells treated with BMP4 showed the highest Id2 gene expression with the lowest Olig1 and Olig2 gene expression, whereas Noggin could block the effect of BMP4. It showed the lowest Id2 gene expression with the highest Olig1 and Olig2 gene expression. The cells incubated with BMSC-CM revealed a lower Id2 gene expression and a higher Olig1 and Olig2 gene expression compared with those of the control groups. BMSC-CM could partly counter the effect of BMP4 on the expression of Id2, Olig1, and Olig2 gene expression in NSCs. The relative expression of Id2, Olig1, and Olig2 was normalized to the housekeeping gene Glucose-6-phosphate dehydrogenase (G6PDH), and the data were expressed as mean ± SD (one-way ANOVA for Id2 expression: F = 49.562, P<0.001, df1/df2 = 4/10, n = 3; one-way ANOVA for Olig1 expression: F = 96.795, P<0.001, df1/df2 = 4/10, n=3; one-way ANOVA for Olig2 expression: F = 40.257, P<0.001, df1/df2 = 4/10, n=3; one-way ANOVA: *P<0.05; NS = P>0.05).

