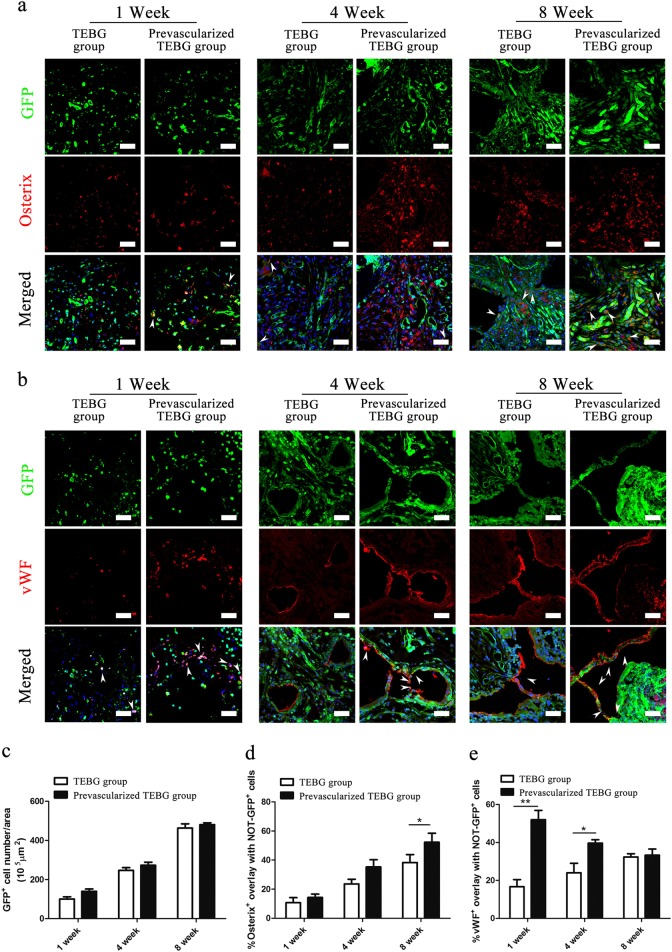
Fig. 4. Prevascularization of TEBGs promoted osteogenic and endothelial differentiation of host cells.
Double-immunofluorescence images of BMSCs (green) and Osterix (red; a) or vWF (red; b) from TEBG sections, scale bar = 50 μm. White arrows represent double-positive staining cells. Hoechst33342 stained the nuclei blue. a, c Host cells migrated into the TEBG pores. c The number of GFP+ cells per area (105μm2), n = 10. d Percentage of Osterix+ cells overlapped with NOT-GFP+ cells, n = 10. e Percentage of vWF+ cells overlapped with NOT-GFP+ cells, n = 10. Data are represented as the mean ± s.e.m. *P < 0.05 as determined by Student’s t-tests

