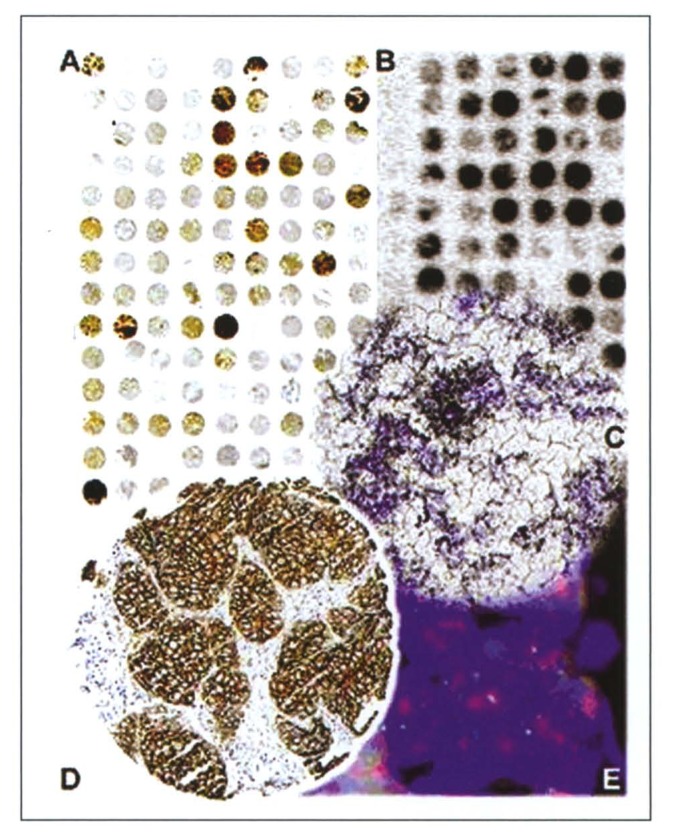
Figure 2.
Tissue microarray applications. Overview of TMA sections investigated by A) immunohistochemistry and B) RNA-ISH. C) Tissue spot showing focal expression (black granular staining) of BTG2 mRNA as investigated by RNA-ISH. The TMA section was coated with a photographic emulsion for detection of a radioactively labeled antisense-RNA probe. D) Tissue spot from a breast cancer array showing strong (3+) membranous staining of the HER2 protein by immunohistochemistry. E) Sector from the same tissue spot as in D) analyzed by FISH, using probes detecting HER2 gene amplification (clusters of red signals) and centromere 17 copy numbers (green signals).

