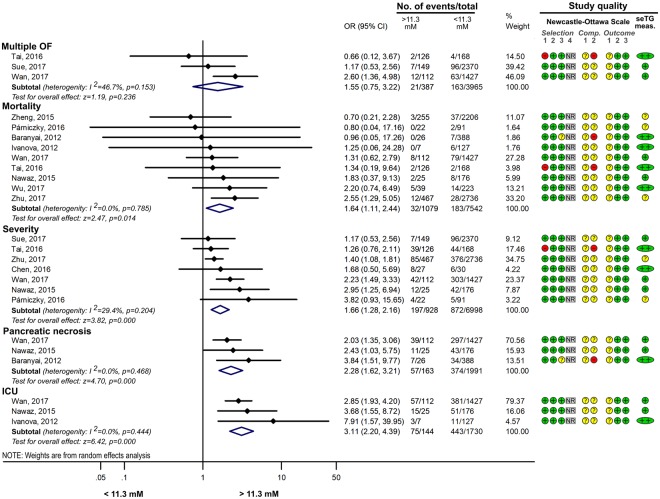
Figure 7.
Forest plot showing the effect of seTG >11.3 mM vs. <11.3 on AP severity, mortality, pancreatic necrosis, the need for ICU admission and multiple OF. Filled rhombuses represent the risk ratio derived from the articles analysed. Horizontal bars represent 95% CI. Empty rhombuses show the overall effect (OR is the middle of the rhombus and CIs are the edges). The quality of studies was assessed by the Newcastle-Ottawa Scale with the timing of the seTG measurement (for more details see Supplementary Table S2). Abbreviations: AP, acute pancreatitis; CI, confidence interval; comp., comparability; ICU, intensive care unit; NR, not relevant; meas., measurement; OF, organ failure; OR, odds ratio; seTG, serum triglyceride concentration.

