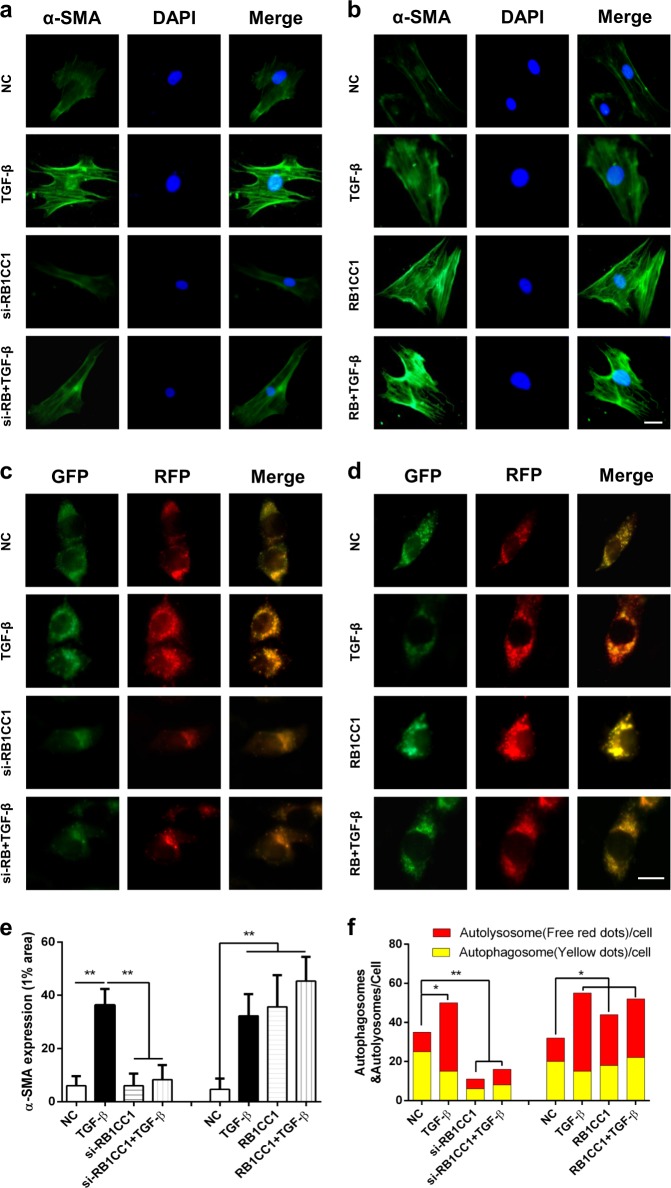
Fig. 3. Knockdown of RB1CC1 inhibits autophagic flux and reduces PSC activation.
a, b The α-SMA expression was explored in primary PSCs of quiescent, TGF-β-treated, RB1CC1-downregulated, si-RB1CC1 plus TGF-β, RB1CC1-upregulated, and pcDNA3.1-encoding RB1CC1 plus TGF-β groups via immunofluorescence staining (bars = 500μm). c, d The immunofluorescence assays were assessed in PSCs which were transfected with flag-tagged mRFP-GFP-LC3 lentiviral vector in eight different groups (bars = 500μm). e The α-SMA expressions in 1% area in different groups. f The numbers of RFP and mRFP dots were determined by fluorescent puncta in five high-power fields. Data are expressed as mean ± SD. The results are representative of three independent experiments (*p < 0.05 and **p < 0.01)

