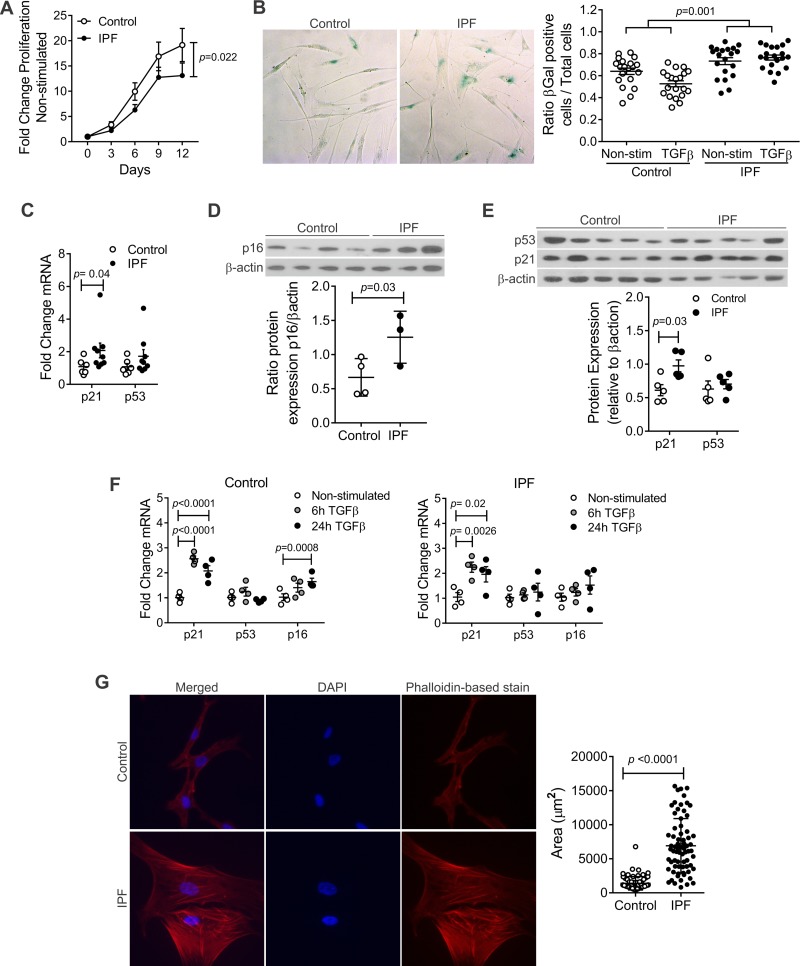
Fig. 1.
Increased senescence in idiopathic pulmonary fibrosis (IPF) human lung fibroblasts (hLFs). A: fold change of proliferation in hLFs, showing statistical significant decreased proliferation in IPF hLFs (P = 0.02; n = 11 control and 8 IPF hLFs). Repeated-measures analysis (mixed model) was applied to test the interaction between time and IPF group as a measure of difference between the 2 groups across time. B: IPF hLFs have higher β-galactosidase (β-gal) expression compared with controls in response to transforming growth factor-β (TGF-β) stimulation (P = 0.001 for interaction between IPF and TGF-β stimulation). The difference of IPF vs. control in response to TGF-β stimulation was analyzed using repeated-measures analysis (mixed effect models in which multiple optical reads from the same line were treated as correlated observations). Alternatively, if we use the average ratio from multiple measures in each subject, the corresponding p for the difference in TGF-β response is 0.041 (n = 4 lines per group). C: fold change of mRNA expression of senescence markers n = 6 in control and 9 in IPF hLFs (means ± SE). Error bars represent SE, and P value was calculated by unpaired t-test. D: protein expression of p16 normalized against β-actin (n = 4 control and 3 in IPF hLFs P = 0.03). Error bars represent SE, and P value was calculated by unpaired t-test. E: protein expression of p21 and p53 normalized against β-actin (n = 5 per group). Error bars represent SE and p-value was calculated by unpaired t-test. F: fold change of mRNA expression of senescence markers upon TGF-β stimulation (n = 4 per group). Bars represent SE. G: phalloidin-based stain and quantification of area of fibroblasts (means ± SE) using Zeuss pro (n = 68 cells in IPF hLFs and n = 71 cells in control hLFs, corresponding to 3 lines in the control group and 4 in the IPF).

