Fig. 5.
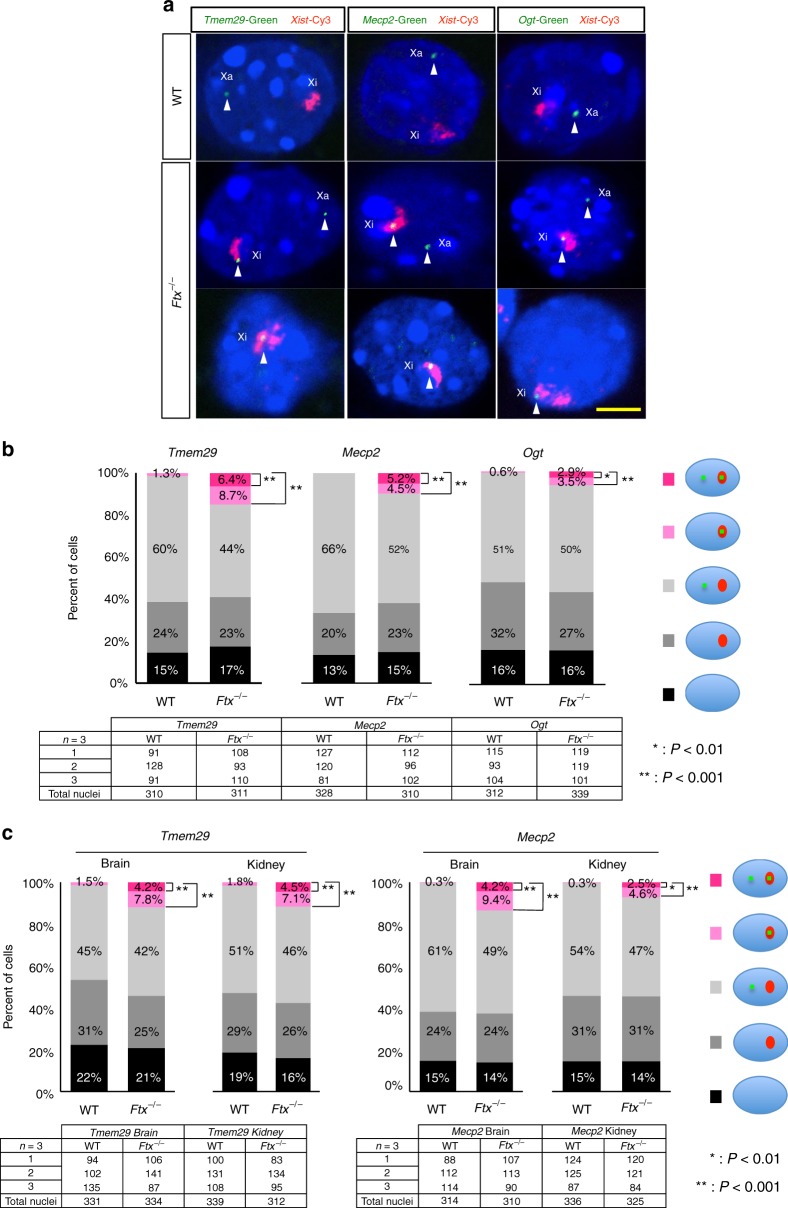
Ftx–/– mice showed partial failure of XCI. a Representative images of RNA–FISH analysis in WT and Ftx–/– female eyes at E13.5, using Xist (in red) and each X-linked gene (in green) as probes. Xa, active X chromosome; Xi, inactive X chromosome. Scale bar = 5 mm. b Frequency of ectopic X-linked gene expression from inactive X chromosomes in eyes at E13.5. Approximately 100 nuclei in each eye were counted from three independent experiments and classified based on the patterns of Xist clouds and nascent X-linked gene transcripts. Cells showing misexpression from the inactive X chromosome are shown as dark or light pink, indicating that XCI was partially compromised in the mutant female (the percentage of the cells labelled in dark pink show signals from the active and inactive X; the percentage of the cells labelled in light pink show signals from inactive X only). Statistically significant differences between WT and Ftx–/– mice were observed by Chi-squared tests; *P < .01, **P < .001). Total cell numbers analysed in each embryo are shown in the table. Nuclei with more than one Xist cloud were not observed. c Frequency of ectopic X-linked gene expression from the inactive X chromosome in brain and kidney cell nuclei at E13.5. Approximately 100 nuclei were counted for each sample, and statistically significant differences were detected between WT and Ftx–/– cells using χ2-tests (*P < .01, **P < .001)

