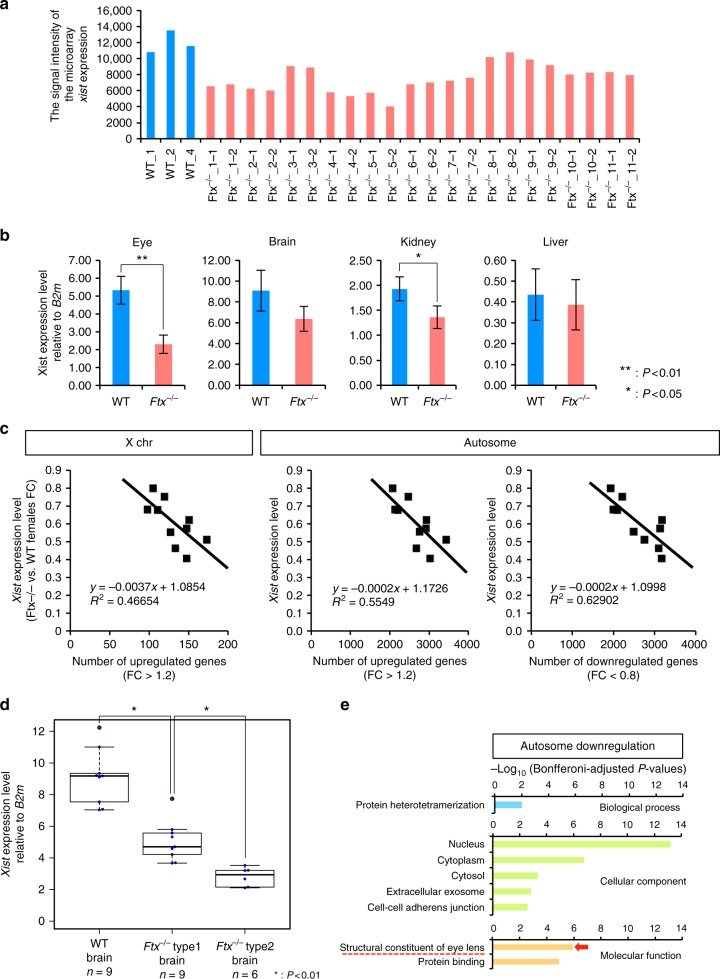
Fig. 6.
Partial failure of XCI correlated with diminished Xist expression in Ftx–/– mice. a Diminished expression of Xist was detected in Ftx–/– females (n = 11; duplicate experiments). In the microarray analysis, seven Xist probes were analysed. They showed similar expression patterns, and the average value of these probes showed significant reduction of Xist expression in Ftx–/– eyes (P = 0.015). Representative values from probe “A_30_P01022001” are shown. The data for other probes are listed in Supplementary Data 1. b RT–qPCR validation of diminished Xist expression in Ftx–/– females at E13.5. All examined tissue samples—eyes, brains, kidneys and livers—were obtained from three different embryos. Significant differences were detected between WT (n = 3) and Ftx–/– (n = 3) mice using a two-tailed, unequal variance t-test (*P < 0.05; **P < 0.01). Error bars, s.d. B2m, beta-2 microglobulin. c Scatter plot showing the correlation between the Xist expression level and the numbers of upregulated and downregulated genes in Ftx–/– (Ftx–/– vs. WT, FC > 1.2 or FC < 0.8). The figures show the correlation between Xist expression level and the numbers of upregulated X-linked genes (FC > 1.2, left panel), the numbers of upregulated autosomal genes (FC > 1.2, middle panel), and the numbers of downregulated autosomal genes (FC < 0.8, right panel), respectively. d Xist expression was the most severely diminished in the brains of the Ftx–/– type 2 mutants. Diminished expression of Xist was detected in the brains of Ftx–/– female embryos at E13.5. Significant differences were detected between WT (n = 9) and Ftx–/– type 1 mutants (n = 9), and also between Ftx–/– type 1 mutants (n = 9) and Ftx–/– type 2 mutants (n = 6) using a two-tailed, unequal variance t-test (*P < 0.01). The box represents the median, 25th and 75th percentiles; whiskers indicate the maximum and minimum values. e Gene ontology analysis using autosomal downregulated genes (Bonferroni-adjusted P-values)

