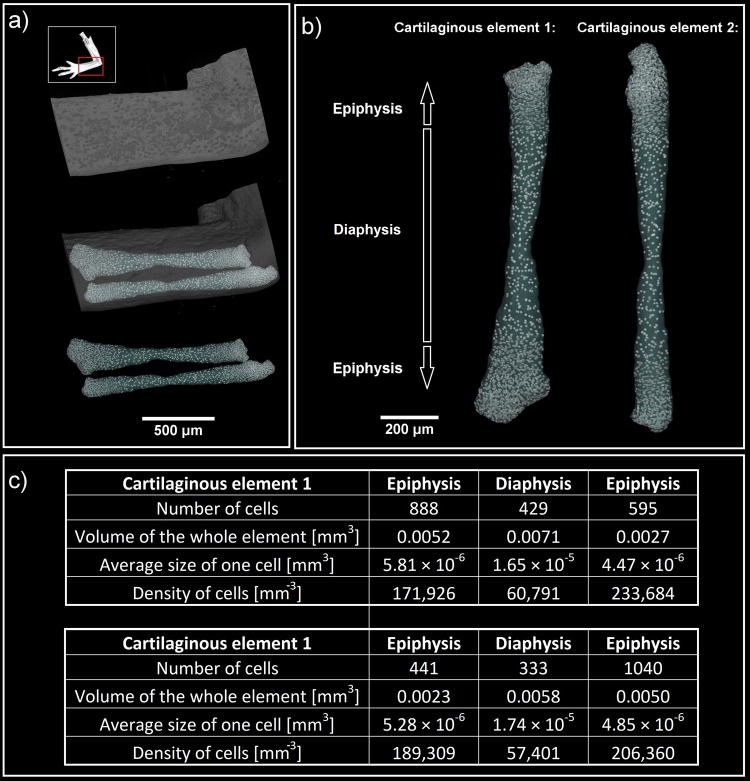
Figure 3.
(a,b) 3D visualization of cartilaginous elements from a developing P. waltl limb forearm. White spots represent cell nuclei. c) Quantitative analysis allowed the determination of cell number, average size (given by ratio of volume of the whole element and number of cells), density and the volume of each cartilaginous element. The difference between diaphysis and epiphysis is evident: the density of cells in the diaphysis is half in comparison with the density in the epiphysis.

