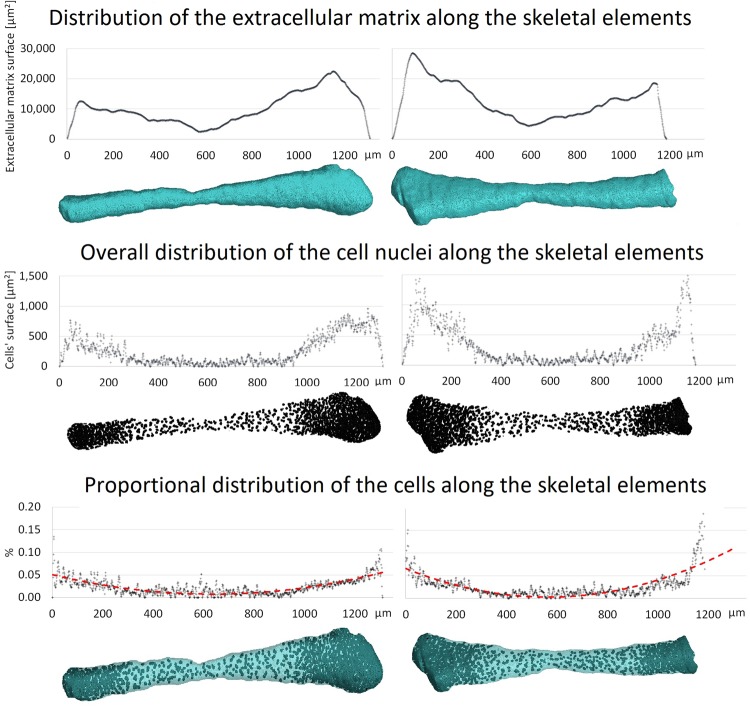
Figure 4.
Distribution of extracellular matrix and cell nuclei along skeletal elements. Top: distribution of the area of extracellular matrix along the element. Middle: distribution of number of cells represented by the area of cell nuclei. Bottom: ratio between the area of cell nuclei and the area of extracellular matrix; the red-dotted line fits the data by a second order polynomial. The minimum of the parabola sits in the centre of the diaphyseal regions.

