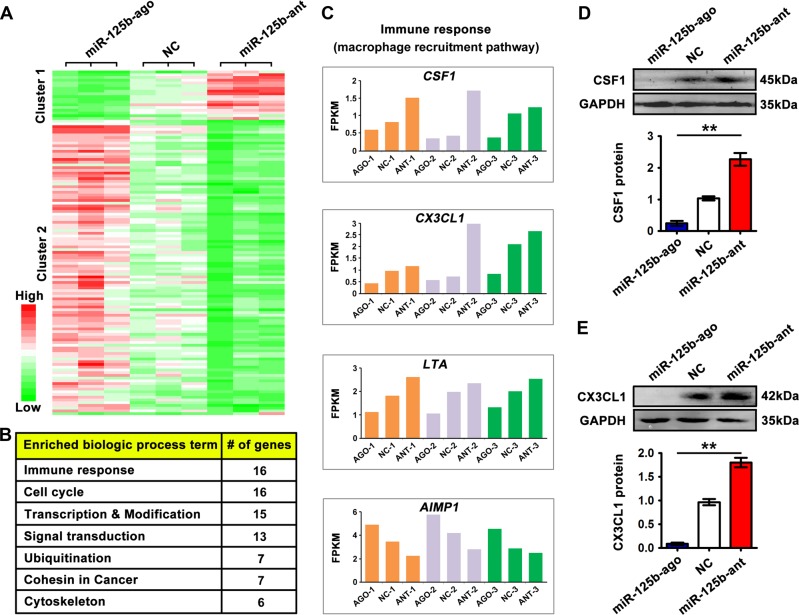
Fig. 5. Transcriptome analysis reveals gene regulation under miR-125b in NCCIT tumor cells.
a Heatmap displaying 125 differentially expressed genes among miR-125b antagomir-, miR-125b agomir-, and NC-transfected NCCIT cells (Table S1). Differentially expressed genes were further clustered into two distinct clusters (cluster 1: miR-125b-negatively regulated genes, n = 18; cluster 2: miR-125b-positively regulated genes, n = 107). b Table of enriched biologic processes by KEGG analysis of differentially expressed genes. c Expression levels (FPKM values) of CSF1, CX3CL1, LTA, and AIMP1 that are suggested to exert macrophage recruitment activities. d, e Protein levels of CSF1 (d) and CX3CL1 (e) were detected in miR-125b knockdown, miR-125b overexpression, and NC NCCIT cells by Western blot analysis and normalized to GAPDH. Asterisks(**) indicates p < 0.01 by one-way ANOVA. Data were presented as the mean ± SEM

