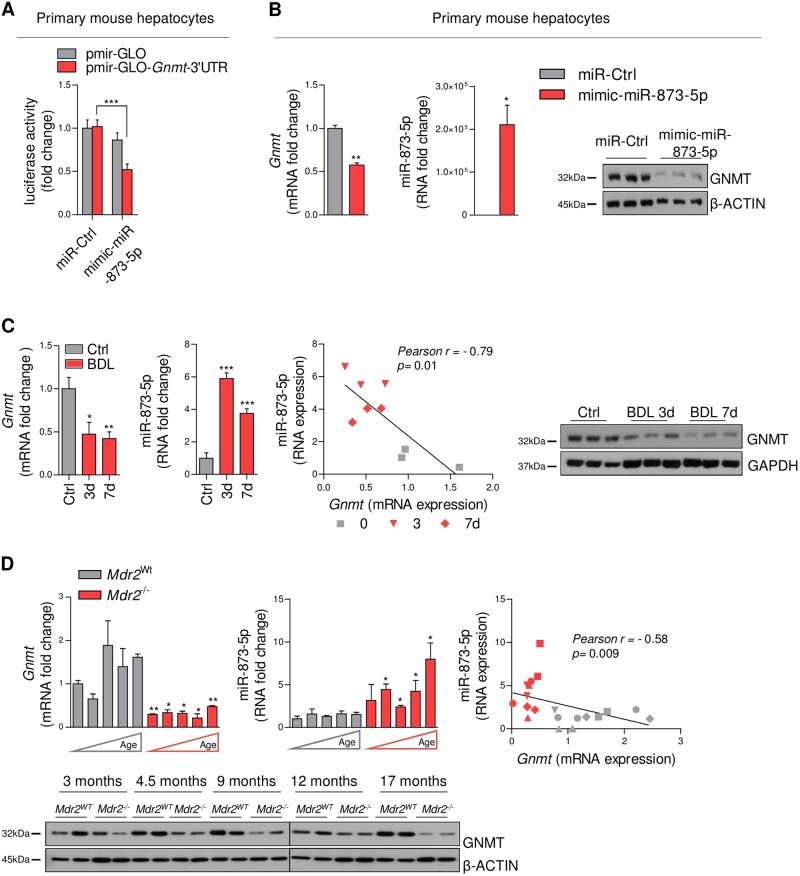
Fig. 1. MiR-873-5p regulates GNMT expression by post-transcriptional repression and miR-873-GNMT levels are negatively correlated in mouse liver cholestasis.
(a) Luciferase reporter assay of Gnmt 3ʹUTR expression in hepatocytes transfected with mimic-miR-873-5p (N = 8). (b) GNMT and miR-873-5p expression at mRNA and protein levels in primary hepatocyte after mimic-miR-873-5p transfection. Gnmt-miR-873-5p expression and correlation and WB analysis of GNMT at different time points of BDL (N = 3) (c) and in Mdr2WT and Mdr2-/- mice at different ages (3,4,9,12,17 months each column and 3▲, 4▼, 9♦, 12●, and 17■ months in the correlation panel) (N = 3) (d). Densitometry analyses of WB are shown in Supp. Fig. 1B, D, E. Data normalized as fold change vs. control. Error bars represent the means ± SEM. Statistical significance was determined by the Student’s t-test or ANOVA when more than two groups were compared. p < 0.05*; p < 0.01**; p < 0.001***

