Fig. 7.
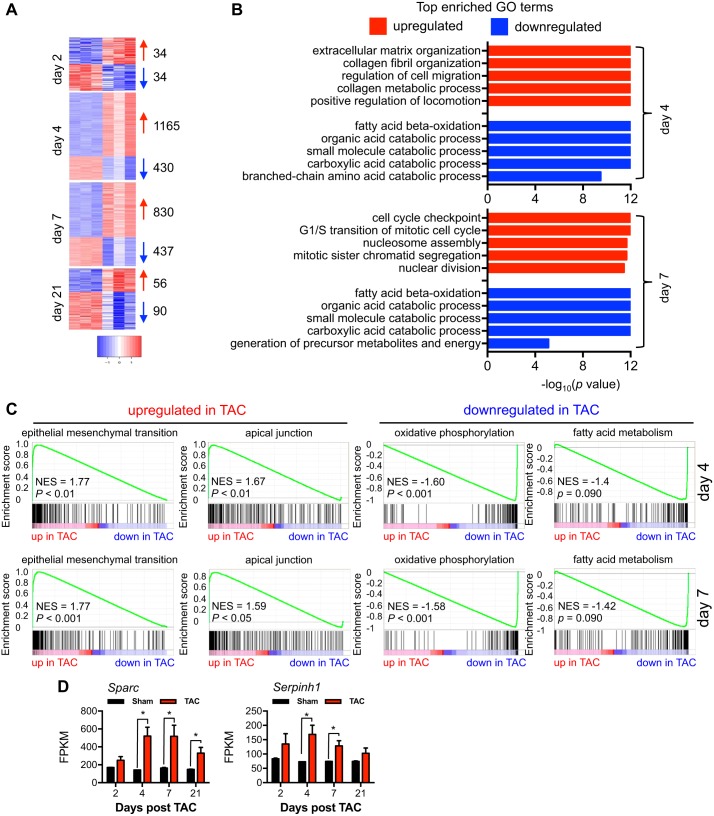
Global analysis of gene expression during cardiac hypertrophic growth. A: RNA-Seq analysis showed that days 4 and 7 were the times with most profound transcriptomic changes. Numbers of genes with significant changes are shown at right. B: the top 5 most enriched Gene Ontology (GO) pathways are shown for both days 4 and 7 after thoracic aortic constriction (TAC). C: based on gene set enrichment analysis analysis, the top up- or downregulated pathways at days 4 and 7 are shown. NES, normalized enrichment score. D: gene expression of secreted protein acidic and rich in cysteine (Sparc) and Serine-arginine protease inhibitor peptidase inhibitor, clade H, member 1 (Serpinh1), two proteins involved in extracellular matrix remodeling and fibrosis, showed a similar temporal dynamics as cardiac hypertrophic growth. FPKM, fragments per kilobases per million fragments. n = 3 for each group. *P < 0.05.

