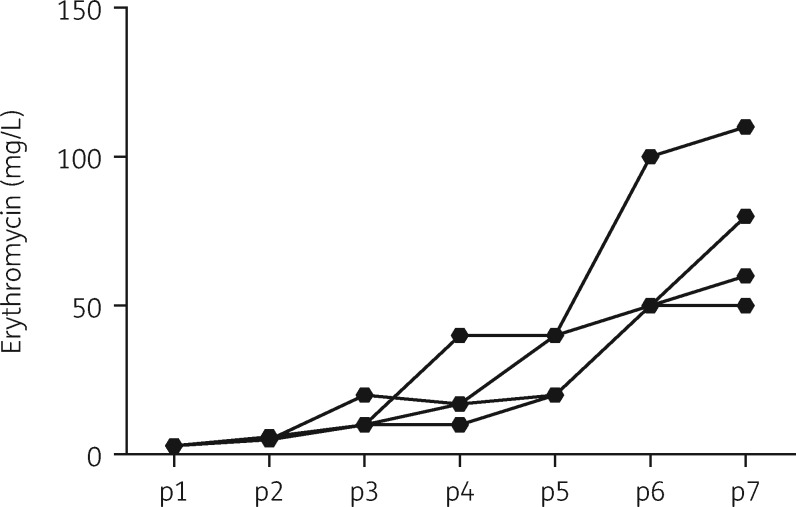
Figure 1.
Increase in erythromycin resistance of B. bronchiseptica RB50 in vitro. The graph traces the average increase in resistance to erythromycin (OD600 ≥0.5) of four lineages of B. bronchiseptica RB50 serially passaged (p1–p7) in the presence of increasing concentrations of the antibiotic. Standard deviation bars are removed for clarity.

