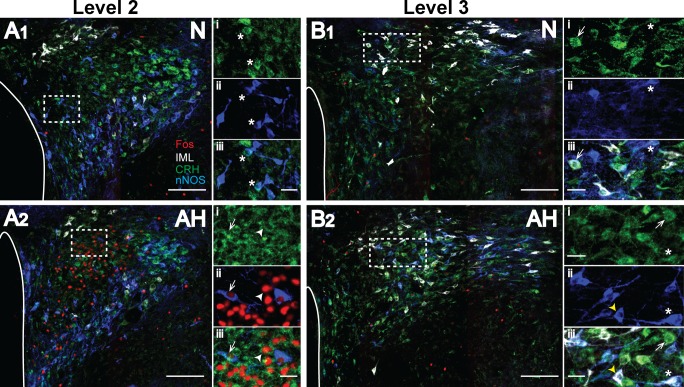
Fig. 6.
Acute hypoxia activates CRH-IR cells in the medial parvocellular region of the PVN. Images are levels 2 and 3 from one N (A1 and B1) and one AH rat (A2 and B2), respectively. Neurons are pseudo-colored: CRH-IR, green; nNOS-IR, blue; Fos-IR, red; spinally projecting neurons, white. Scale bars = 200 µm. The third cerebral ventricle is outlined on the left side of PVN images. Higher-magnification image of dashed line box in each image are shown to the right; scale bars = 25 µm. A1: i, CRH; ii, nNOS; iii, merged image from medial parvocellular region of an N rat. Asterisk denotes CRH-nNOS cells. A2: i, CRH; ii, Fos-nNOS; iii, merged image from medial parvocellular region of an AH rat. Arrowhead denotes CRH-Fos cell, and arrow denotes CRH-nNOS-Fos cell. B1: i, CRH; ii, nNOS; iii, merged image, including IML-labeled cells in an N rat. Arrow denotes a CRH-IML cell, while asterisks denote a CRH-nNOS-IML cell. B2: i, CRH; ii, nNOS; iii, merged image, including IML-labeled cells in an AH rat. Arrow denotes a CRH-IML cell, while an arrowhead denotes an nNOS-IML cell, and an asterisk denotes a CRH-nNOS-IML cell.

