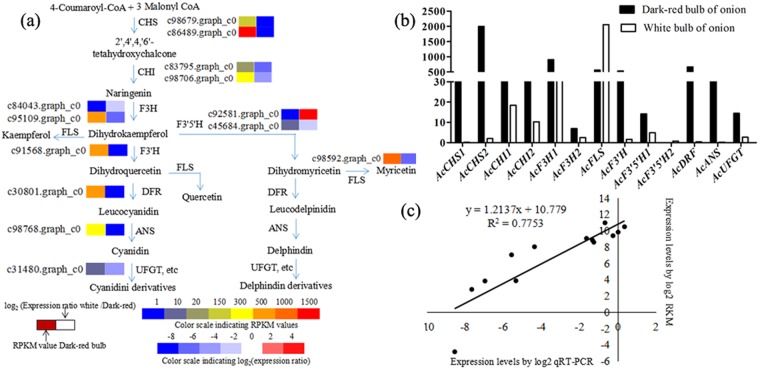
Figure 4.
Physiological and metabolic data related to onion bulb pigmentation. (a) Detailed Cy and Del metabolic network showing subsets of nodes or metabolites that constitute this process. Enzyme and unigene names as well as expression patterns are listed next to each step, while expression patterns are summarized in two boxes; the PRKM values for dark-red onions are on the right, while the log2 expression ratio of white/dark-red are on the left; (b) Transcript accumulation of color-related genes involved in the anthocyanin metabolic process; (c) Gene expression correlation analysis for color-related genes in dark-red onion based on qRT-PCR and RNA-seq. Abbreviations as in Fig. 1.

