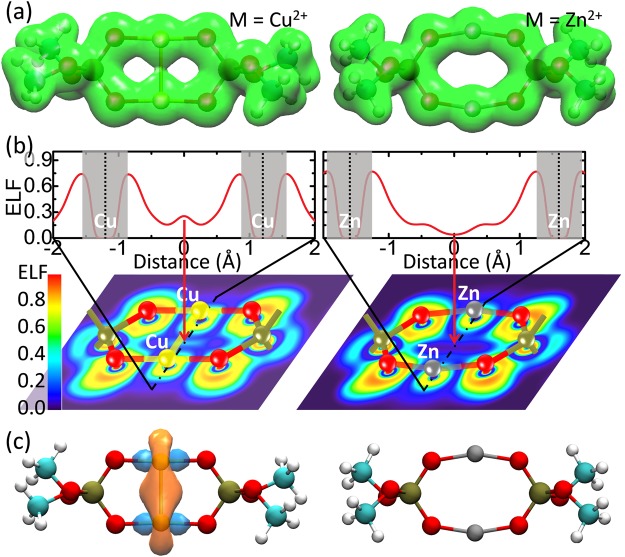
Figure 4.
Electron analyses of Cu ions (left column) in State II by comparison with Zn ions (right column). The cyan, brown, red, white, yellow and dark gray balls represent carbon, phosphorus, oxygen, hydrogen, copper and zinc, respectively. (a) Electron densities. The green cloud denotes the electron density with an isosurface of 0.04 e/Å3. (b) Electron localized function (ELF). Upper: One-dimensional ELF along the metal-metal direction. The gray area indicates the region of core electrons, where ELF decays and quickly vanishes because a pseudo potential is employed in DFT calculations. Lower: Two-dimensional ELF. The pattern of ELF is approximately square in the area close to a Cu ion (lower-left) and is a circle in the area close to a Zn ion (lower-right). These suggest that the outermost electrons majorly occupy the 3d orbital for Cu and the 4 s orbital for Zn. (c) Natural bond orbital between metal ions. The orange and light blue clouds indicate the orbital with an isosurface of 0.04 e/Å3. A metal-metal bond orbital occurs for Cu ions but not for Zn ions. For clarity, water molecules are not shown.

