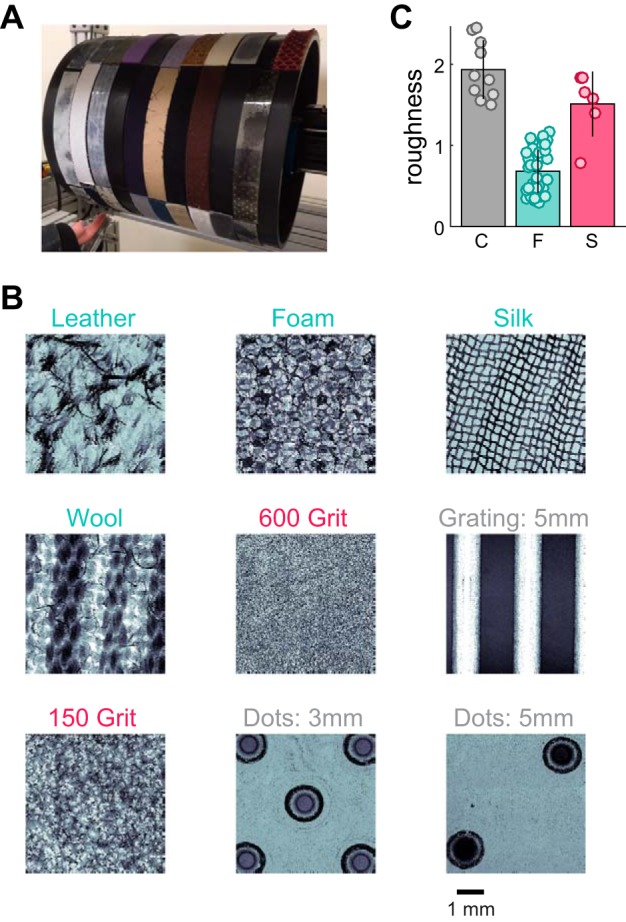
Fig. 1.

Experimental apparatus, sample textures, and roughness judgments. A: rotating drum stimulator. B: the surface microstructure (profilometry) of 9 example textures, ordered from smoothest (top left) to roughest (bottom right; across rows, then columns). Fine textures are colored in cyan, coarse textures in gray, and sandpapers in red. C: perceived roughness for each texture, split by texture group (C, coarse; F, fine; S, sandpaper). Each point represents a single texture. Bars denote mean roughness across the group, and error bars denote SD. Units of roughness are such that the mean roughness of all 55 textures is normalized to 1.
