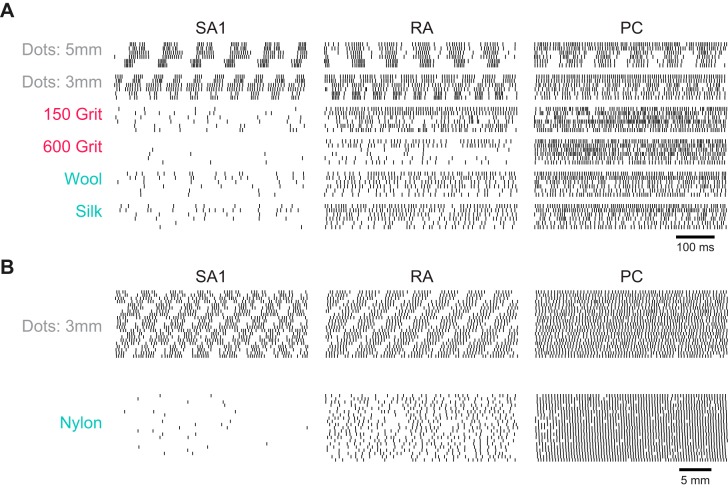
Fig. 2.
Afferent responses to natural textures. A: spiking responses to 6 different textures from SA1, RA, and PC fibers (responses to 2 repeated presentations of each texture from 3 example afferents of each type). Textures are ordered from roughest (top) to smoothest (bottom); colors correspond to the texture categories as indicated in Fig. 1. B: spatial event plots for 2 textures reconstructed from the responses of one afferent of each type (5 mm corresponds to 62.5 ms at 80 mm/s) obtained in a dedicated protocol (see materials and methods). Each patch consists of repeated parallel scans of the texture across the receptive field of the afferent, each shifted perpendicular to the scanning direction by 0.5 mm, yielding a spatial image (cf. Johnson and Phillips 1988).

