Fig. 5.

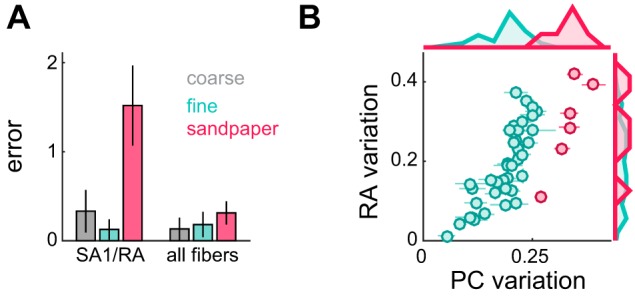
PC contribution to roughness perception: the case of sandpapers. A: comparison between 2 regression models: one using only SA1/RA afferent responses and one using all 3 afferent types. Cross-validated errors (leave-one-out procedure; see materials and methods) are plotted as medians ± median absolute deviations. With PC variation, model performance significantly improves. B: RA variation vs. PC variation for fine textures and sandpapers. Each point represents the mean response across afferents to a single texture. Error bars denote SE. Marginal histograms are plotted at top and right. RA sandpaper responses are very similar to fine texture responses, despite the fact that sandpapers are significantly rougher. PC responses separate sandpapers from fine textures.
