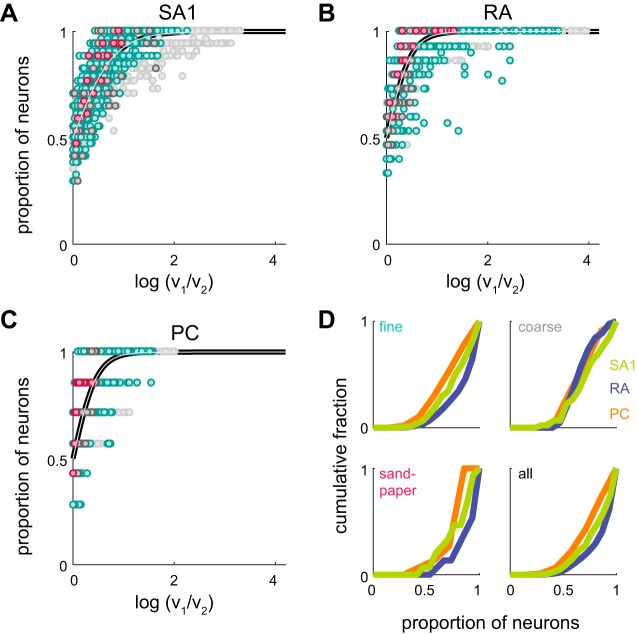
Fig. 6.
Afferent reliability. A–C: across-fiber consistency. For every possible texture pair, the proportion of afferents with a higher mean variation for one texture than another is plotted against the log ratio of variation values (mean across afferents) for those textures. These values are plotted for SA1 (A), RA (B), and PC fibers (C). Pairs of fine textures are plotted in cyan, coarse textures in dark gray, and sandpapers in red. All other pairs (only mixed pairs, e.g., a sandpaper and a fine texture) are plotted in light gray. The black and gray line denotes the best fit sigmoid (see materials and methods). D: cumulative distributions of across-fiber consistency (SA1 afferents in light green, RA afferents in dark blue, PC afferents in orange) for pairs of fine textures (top left), coarse textures (top right), and sandpapers (bottom left). All possible texture pairs are combined at bottom right.

