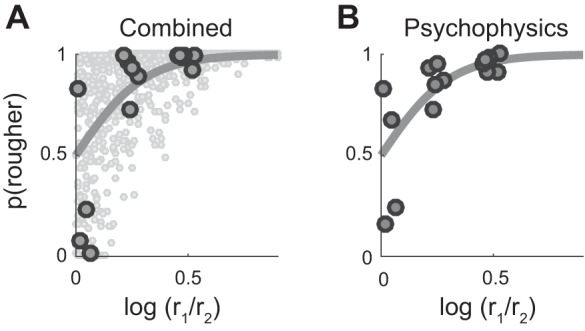
Fig. 7.

Roughness discrimination. A: ideal observer analysis based on the summed (single trial) variation of 5 afferents of each type, weighted by type, as a function of the roughness ratio (obtained in the magnitude estimation experiment) for every texture pair. Specifically, for a given pair of textures, r1 (r2) is the roughness rating for the rougher (smoother) of the two textures). A subset of these (larger black dots) were used in a roughness discrimination experiment. A best-fit curve is plotted in gray (threshold ratio = 0.15, yielding a Weber fraction = 0.17). Performance values below 50% fall within the margin of error of the mean ratings, highlighting the sensitivity of discrimination relative to magnitude estimation. B: mean psychophysical performance of 7 human subjects on a roughness discrimination task, for all possible pairs of 6 different textures, plotted against the log ratio of roughness judgements. A best-fit curve is plotted in gray (Weber fraction = 0.17). Performance thresholds are similar for psychophysical and neurometric judgments of texture roughness.
