
Fig. 8.
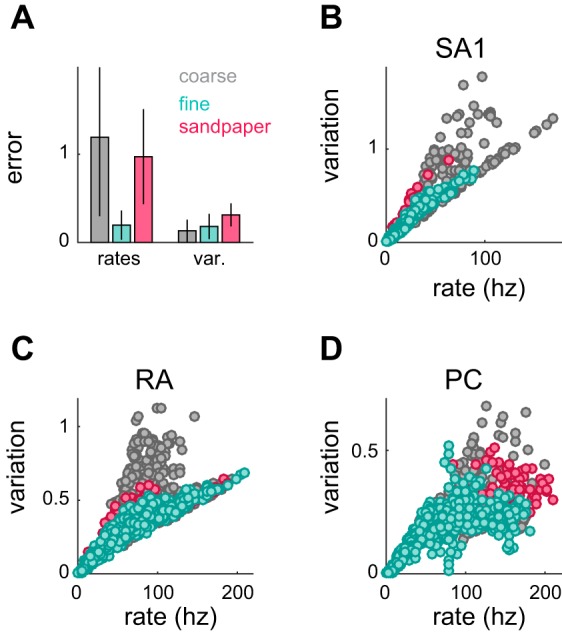
Response rate vs. variation and roughness predictions. A: comparison between 2 models, one using only firing rates from all 3 afferent types and one using response variation from all 3 afferent types. Cross-validated errors (leave-one-out procedure; see materials and methods) are plotted as medians ± median absolute deviations and are broken down by texture subtype. The model using variation greatly reduces the error in predicting the roughness of coarse textures and sandpapers. B–D: variation vs. firing rate for SA1 (A), RA (B), and PC fibers (C). Coarse texture responses exhibit a wider range of variation values for a given firing rate.