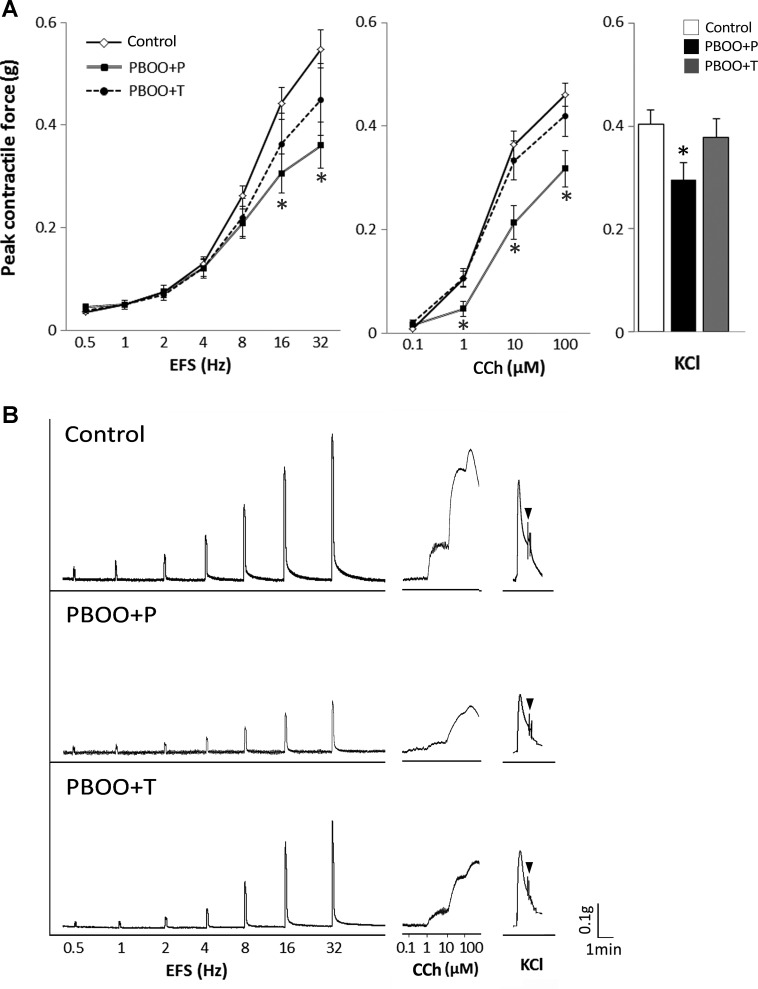
Fig. 3.
Peak contractile force of bladder strips. A: control, PBOO + P, and PBOO + T groups in response to: electric field stimulation (EFS; left), carbachol (CCh; middle), and high concentration of KCl (right). B: representative raw traces of contractions in response to EFS (left), CCh (middle), and KCl (right) from each group. The force was normalized with tissue weight. Arrowheads indicate the end point of KCl. Values are means ± SE; n = 14 in each group. *P < 0.05 vs. control group.

