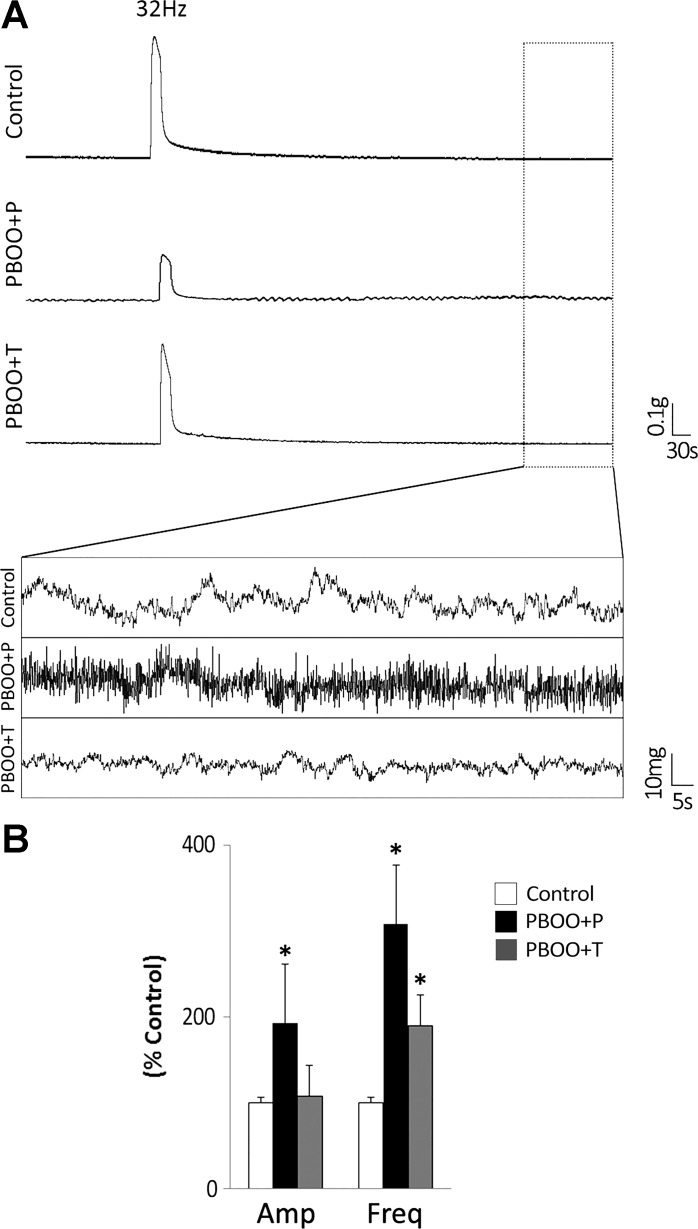
Fig. 4.
Comparison of basal activity of bladder strips from each group. A: the representative trace of spontaneous contractile activity of detrusor smooth muscle (DSM) strips from control, PBOO + P, and PBOO + T groups without any stimuli. B: the amplitude and the frequency of spontaneous contractions of the bladder strip in PBOO + P and PBOO + T groups relative to those in control group (taken as 100%). Both PBOO groups showed a significant increase in the frequency compared with control mice. In addition, the amplitude was significantly larger in PBOO + P group compared with that in control. Values are means ± SE. *P < 0.05 vs. control group.

