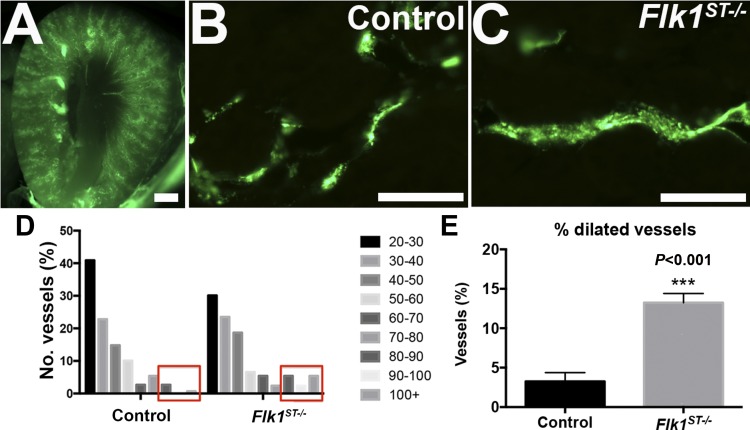
Fig. 4.
Fluorescent microangiography confirms dilated peritubular capillaries. A and B: representative images from fluorescent microangiography at P30 kidneys showing low (A)- and high-power (B) images of controls. C: representative image of a dilated capillary in the mutant. D: graph of the distribution of the microvessel caliber (area, μm2) from angiography reveals that the mutant microvasculature has a shift to the right, indicating relatively dilated capillaries compared with controls. E: histogram showing the percentage of dilated vessels. Scale bars: A = 1, 000 μm; B = 100 μm; n = 5 for both groups.

