Fig. 7.
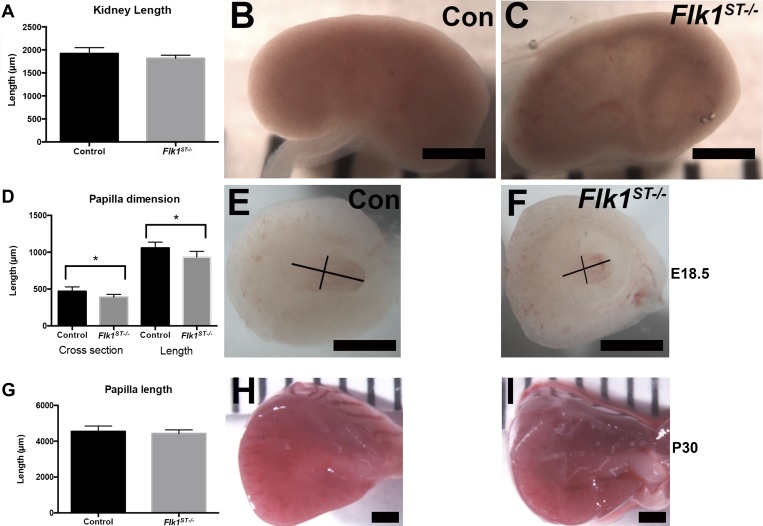
Mutant kidneys have comparable size but variable papillary hypoplasia. A: histogram showing that the kidney length is unaltered in mutants in comparison to controls. B and C: wholemount images that depict the subset (12/20) of mutant kidneys which are hollowed out (translucent) (C) in comparison to controls (B) at E18.5. D: histogram showing that the mutant papilla at E18.5 is hypoplastic in the mutants compared with controls (control: n = 24; Flk1ST−/−: n = 8). E and F: wholemount images of the kidneys that were bisected revealing the hypoplastic papilla even in the mutant kidneys that did not appear hollowed out (F) compared with controls (E). The black lines are representative of the measurements of the lengths and cross sections of the papilla. G: histogram of papilla length at P30 shows no difference between control and mutants. H and I: wholemount images of P30 juvenile kidneys that were bisected depicting equivalent renal papilla in the control and mutant kidneys. Scale bars: B, C, E, F, H, and I = 1,000 μm.

