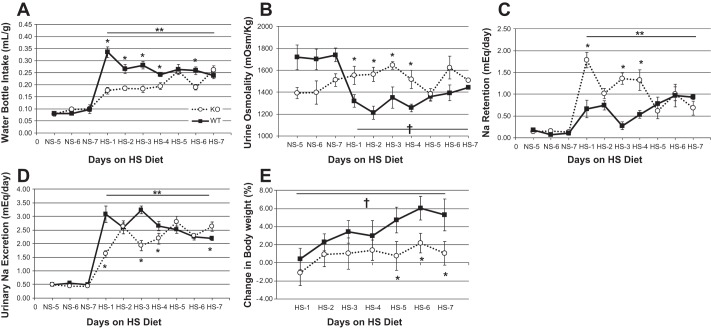
Fig. 3.
HKα1−/− mice have impaired dipsogenic response to a high-Na+ (HS) diet. A: water bottle intake in WT and HKα1−/− mice shown normalized for body weight. B: urine osmolality. C: urinary Na excretion. D: Na+ retention calculated as the difference between Na+ intake and urinary output. E: change in body weight. *P < 0.05, WT vs. HKα1−/−, Tukey's test; **P < 0.001 NS vs. HS within same genotype, one-way repeated-measures ANOVA. †P < 0.001 normal-Na+ diet (NS) vs. HS within WT only, one-way repeated-measures ANOVA. All data are shown as means ± SE for days 5–7 of NS and days 1–7 of HS. WT (n = 6–7); K HKα1−/− (n = 6). Solid lines, WT; dotted lines, HKα1−/−.

