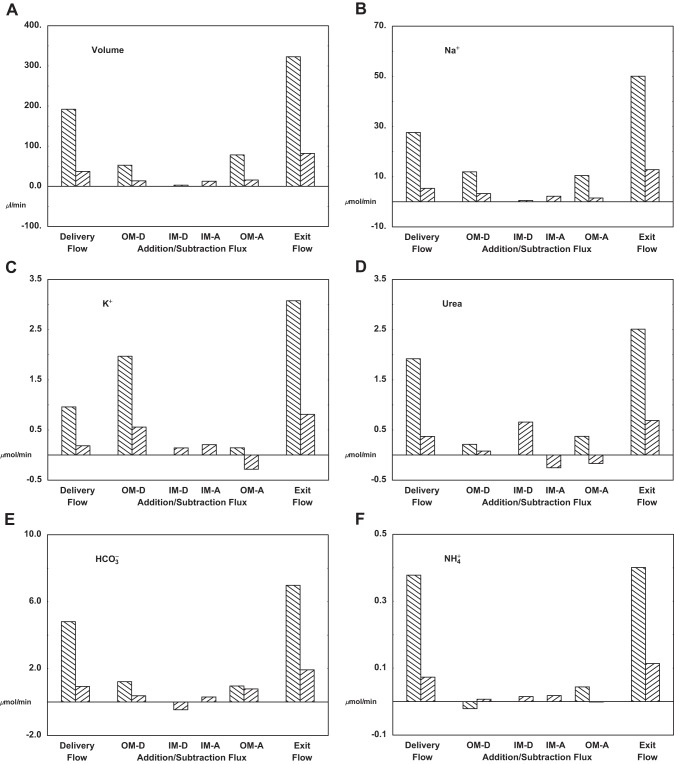
Fig. 7.
Whole kidney vascular flows and fluxes under baseline conditions. In each pane, the left bars show delivery to the vessels (initial DVR flow); middle bars are additions and subtractions with OM and IM; and the right bars show exit from the vessels (end-AVR flow). For delivery and exit flows, and within OM, the bars are in pairs indicating flows and fluxes of short (\) and long (/) vessels.

