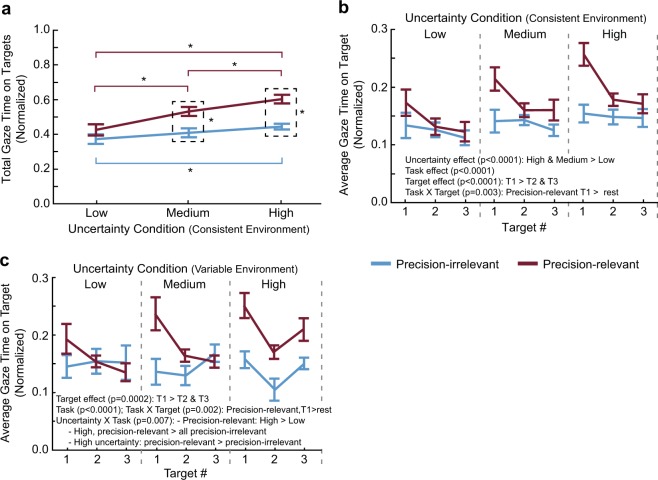
Figure 2.
Gaze behaviour. Total gaze time on targets (a) and average gaze time on a target (b) across uncertainty conditions and tasks in the consistent environment experiment. (c) Average gaze time on a target for each uncertainty level and task in the variable environment experiment. Data are represented as mean ± SE. Gaze times are normalized (i.e., divided) by trial duration to control for differences in gait speed between trials and conditions. *Indicates that values are significantly different from each other based on post hoc tests following a significant Task X Uncertainty condition interaction (p < 0.05).

