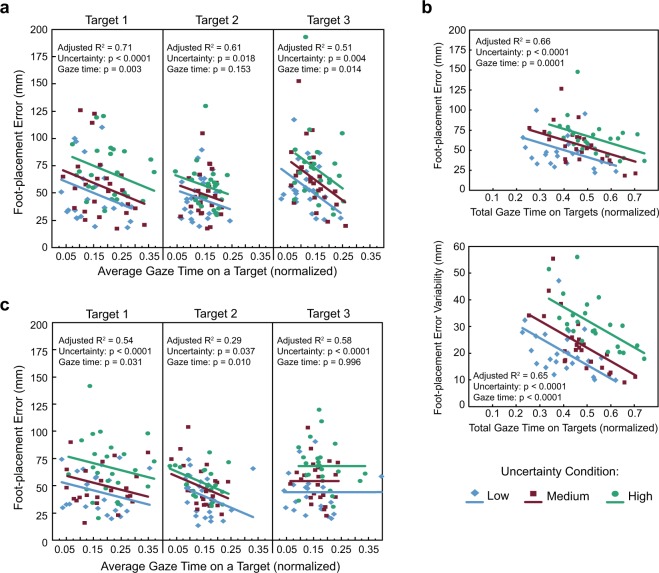
Figure 6.
Relationship between gaze behaviour and foot-placement accuracy. (a) Scatterplots of average gaze time on a target and foot-placement error for the Low, Medium, and High uncertainty conditions in the consistent environment. (b) Scatterplots of total gaze time on targets and foot-placement error (top panel) or foot-placement error variability (bottom panel) for the Low, Medium, and High uncertainty conditions in the consistent environment. (c) Scatterplots of average gaze time on a target and foot-placement error for the Low, Medium, and High uncertainty conditions in the variable environment. Solid lines show the linear fits obtained from the ANCOVAs.

