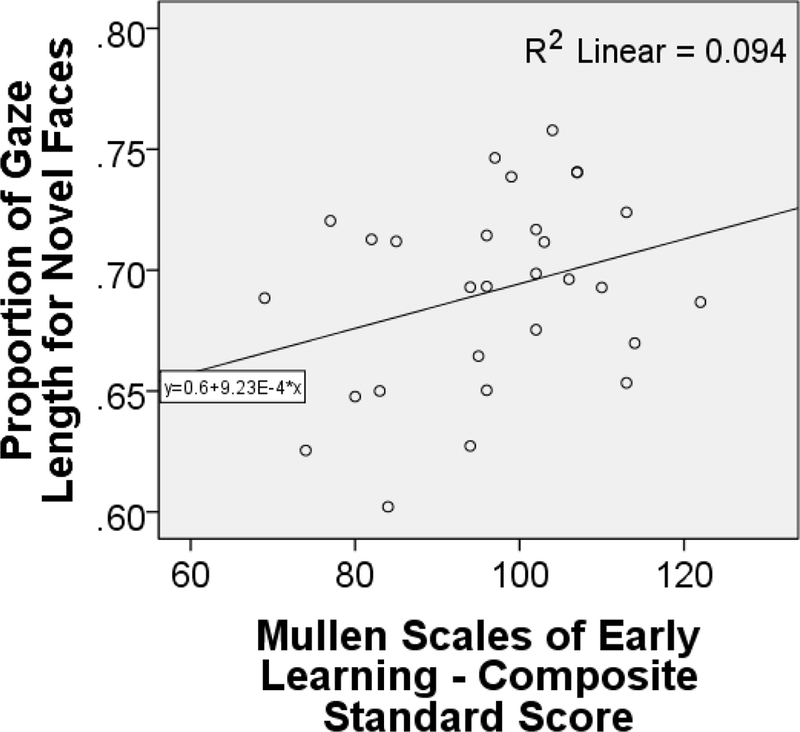
Figure 3 Caption.

This is a scatterplot with a least-squares fit line depicting the relationship between the Fagan Test Tobii eye tracking measure of proportion of face viewing time viewing the novel face presentations, and the Mullen Scales of Early Learning (MSEL) standardized composite score for the cognitive scales (Visual Reception, Fine Motor, Receptive Language, and Expressive Language
