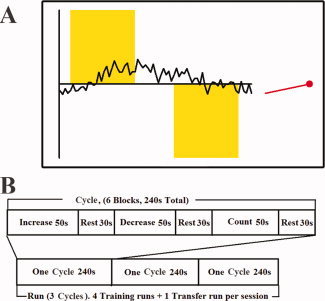
Figure 2.

(A) Illustration of the experimental display and BOLD signal feedback viewed by subjects in Experiment A. The feedback consisted of a scrolling line chart, a red indicator, and a cue word. The red indicator showed the current feedback signal in the ROI. The scrolling line chart displayed the time‐course of the feedback signal in the ROI during the preceding 150‐s period was updated every TR (2 s). When the cue word was “INCREASE,” a yellow bar appeared in the upper part of the graph. When the cue word was “DECREASE,” the yellow bar was presented in the lower part of the graph. When the cue word was “COUNT,” a yellow bar was presented both above and below the x‐axis. No yellow bar was presented during the “STOP” cue. (B) Schematic diagram of Experiment A.
