
Figure 4.
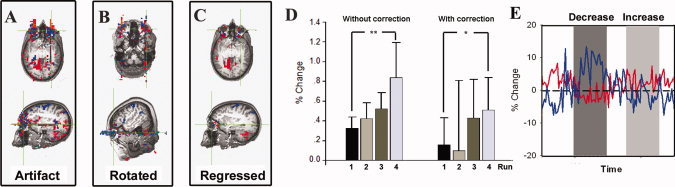
(A) Illustration of the BOLD signal artifact in one representative participant in Experiment A (following GLM analysis). The threshold in (A–C) is P uncorrected < 0.005 with a four voxel minimum volume. (B) Results from a representative participant in Experiment A where a 40° rotation of the phase encoding direction resulted in a corresponding rotation of the artifact. (C) Residual BOLD signal artifact after the BOLD time‐course from the orbit in (A) was included as a regressor during the GLM analysis. (D) Group average BOLD signal from the left insula ROI obtained during real‐time fMRI feedback training. **P < 0.02, *P < 0.05. (E) Partial time‐course from two voxels showing significant artifacts in (A). The blue line is from a blue voxel in (A) and shows significant negative activity. The red line is from a red voxel in (A) and shows significant positive activity.