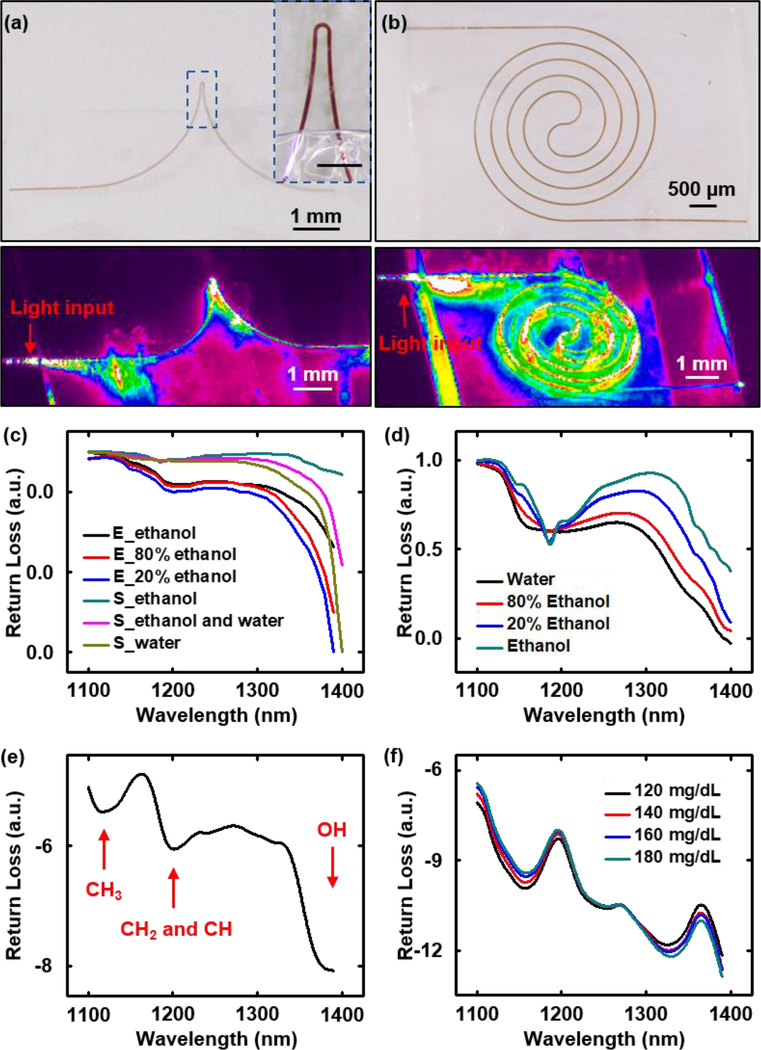
Figure 5. Transient Si waveguide-based biosensor.
(a) Optical sensor that uses a PLGA-clad Si waveguide with an exposed (top, bottom and side surfaces) region that has a U shape (thickness 1500 nm, width 50 μm) where the evanescent field interacts with the surrounding environment. Inset: enlarged view of this sensing region. Scale bar: 300 μm. (b) Similar device but with a sensing region that adopts a spiral shape, with the Si core exposed on the top and side surfaces, with a 10 μm-thick film of PLGA on its base. (a), (b) Upper: Optical micrograph of the sensing region. Lower: propagation profile of near infrared light (1550 nm) through this region. (c) Experimental and simulation results of the transmission spectrum of a U-shaped transient biosensor immersed in a mixture of water and ethanol, as measured in terms of the return loss. E_ethanol, E_80% ethanol, and E_20% ethanol are experimental measurements; S_ethanol, S_ethanol and water, and S_water are simulation results. (d) Transmission spectrum of a mixture of water and ethanol measured with a UV/Vis/NIR spectrometer (Perkin Elmer LAMBDA 1050). (e) Transmission spectrum measured in terms of the return loss of a spiral-shaped transient biosensor immersed in photodefinable epoxy (SU8). (f) Transmission spectrum measured in terms of return loss of a spiral-shaped transient biosensor immersed in mouse blood with different concentrations of glucose.

