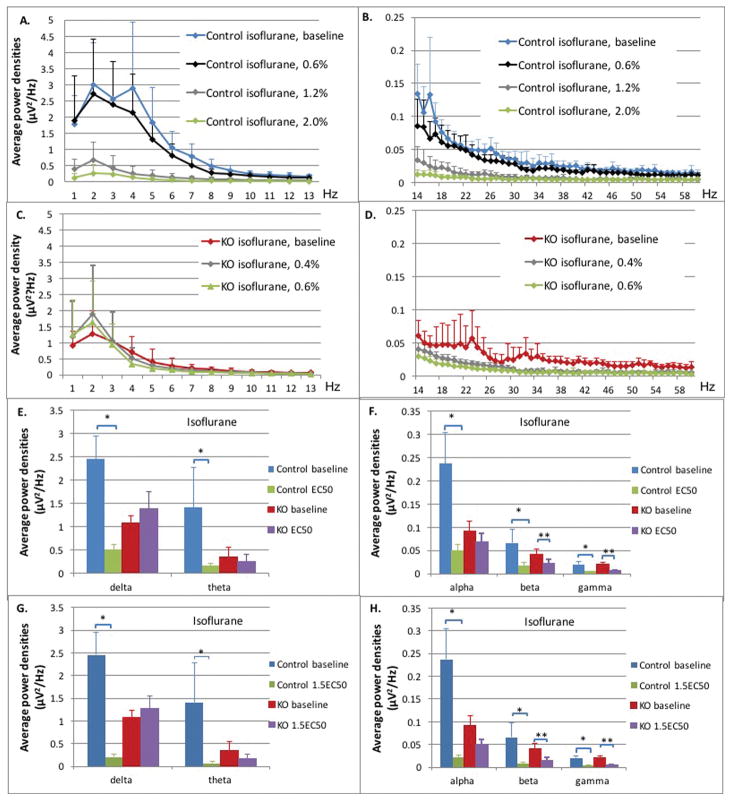
Figure 3. Control and Ndufs4(KO) mice in isoflurane.
A–D: Average power densities plotted against frequency bands at different isoflurane concentrations. All points in curves in A–D represent an average of the bin including one Hz plotted at the upper value of that range. The value at 1Hz represents the bin from 0–1Hz, the 2Hz value represents the bin from 1–2Hz, for example. Data points represent the mean of all exposures (n=5 both genotypes). Error bars represent standard deviations. (A) Delta, theta and alpha frequency ranges from 1 Hz – 13 HZ, control mice. (B) Beta and gamma ranges from 14 Hz – 60 HZ, control mice. (C) Delta, theta and alpha frequency ranges from 1 Hz – 13 HZ, Ndufs4(KO). (D) Beta and gamma ranges from 14 Hz – 60HZ, Ndufs4(KO). E–F: Comparison for control and KO between baseline and isoflurane at EC50s. Average power densities in each frequency band at baseline and EC50 isoflurane concentrations in control and KO groups: (E) delta and theta frequency bands; (F) alpha, beta and gamma frequency bands. Error bars are standard deviations. N=5 in all cases. Single and double stars for significance comparisons are only to indicate control and KO genotypes, respectively. G–H: Comparison for control and KO between baseline and isoflurane at 1.5XEC50s. Average power densities in each frequency band at baseline and 1.5XEC50 isoflurane concentrations in control and KO groups: (G) delta and theta frequency bands (H) alpha, beta and gamma frequency bands. Error bars are deviations. N=5 in all cases. Single and double stars for significance comparisons are only to indicate control and KO genotypes, respectively.

